

quality of a sequencing run and are widely used in NGS data production environments as
an initial QC checkpoint [12]. This tool provides a modular set of analyses which you can
use to give a quick impression of whether your data has any problems of which you should
be aware before doing any further analysis.
The main features of FastQC are:
• Import of data from *.bam, *.sam, or *.fastq files (any variant).
• Providing a quick overview to tell you in which areas there may be problems. In a
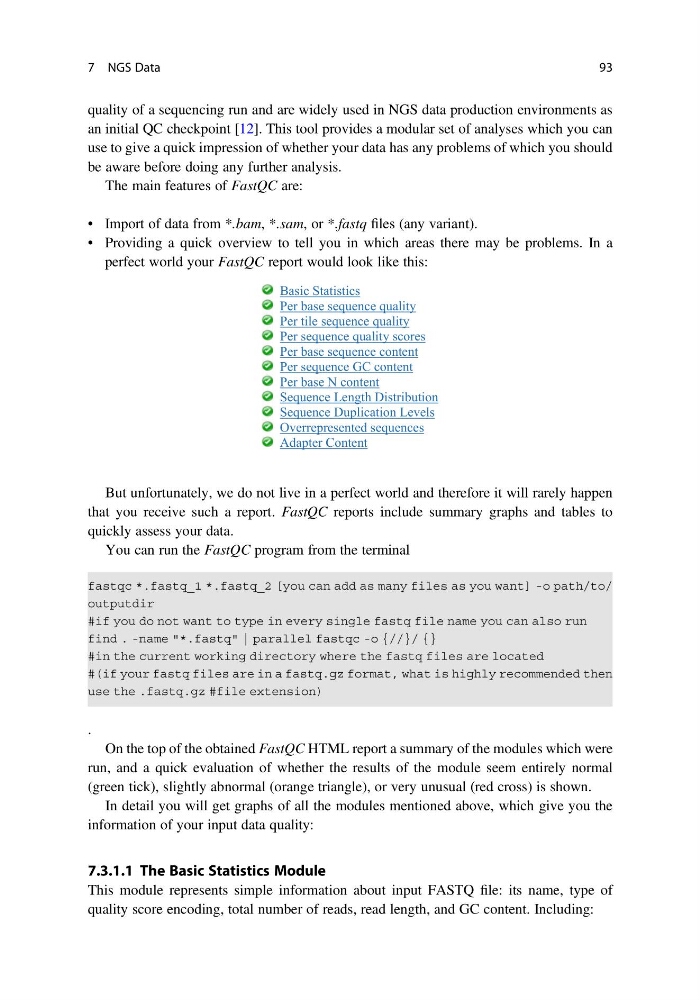
perfect world your FastQC report would look like this:
Basic Statistics
Per base sequence quality
Per tile sequence quality
Per sequence quality scores
Per base sequence content
Per sequence GC content
Per base N content
Sequence Length Distribution
Sequence Duplication Levels
Overrepresented sequences
Adapter Content
But unfortunately, we do not live in a perfect world and therefore it will rarely happen
that you receive such a report. FastQC reports include summary graphs and tables to
quickly assess your data.
You can run the FastQC program from the terminal
.
On the top of the obtained FastQC HTML report a summary of the modules which were
run, and a quick evaluation of whether the results of the module seem entirely normal
(green tick), slightly abnormal (orange triangle), or very unusual (red cross) is shown.
In detail you will get graphs of all the modules mentioned above, which give you the
information of your input data quality:
7.3.1.1 The Basic Statistics Module
This module represents simple information about input FASTQ file: its name, type of
quality score encoding, total number of reads, read length, and GC content. Including:
7 NGS Data
93
an initial QC checkpoint [12]. This tool provides a modular set of analyses which you can
use to give a quick impression of whether your data has any problems of which you should
be aware before doing any further analysis.
The main features of FastQC are:
• Import of data from *.bam, *.sam, or *.fastq files (any variant).
• Providing a quick overview to tell you in which areas there may be problems. In a
perfect world your FastQC report would look like this:
Basic Statistics
Per base sequence quality
Per tile sequence quality
Per sequence quality scores
Per base sequence content
Per sequence GC content
Per base N content
Sequence Length Distribution
Sequence Duplication Levels
Overrepresented sequences
Adapter Content
But unfortunately, we do not live in a perfect world and therefore it will rarely happen
that you receive such a report. FastQC reports include summary graphs and tables to
quickly assess your data.
You can run the FastQC program from the terminal
.
On the top of the obtained FastQC HTML report a summary of the modules which were
run, and a quick evaluation of whether the results of the module seem entirely normal
(green tick), slightly abnormal (orange triangle), or very unusual (red cross) is shown.
In detail you will get graphs of all the modules mentioned above, which give you the
information of your input data quality:
7.3.1.1 The Basic Statistics Module
This module represents simple information about input FASTQ file: its name, type of
quality score encoding, total number of reads, read length, and GC content. Including:
7 NGS Data
93