

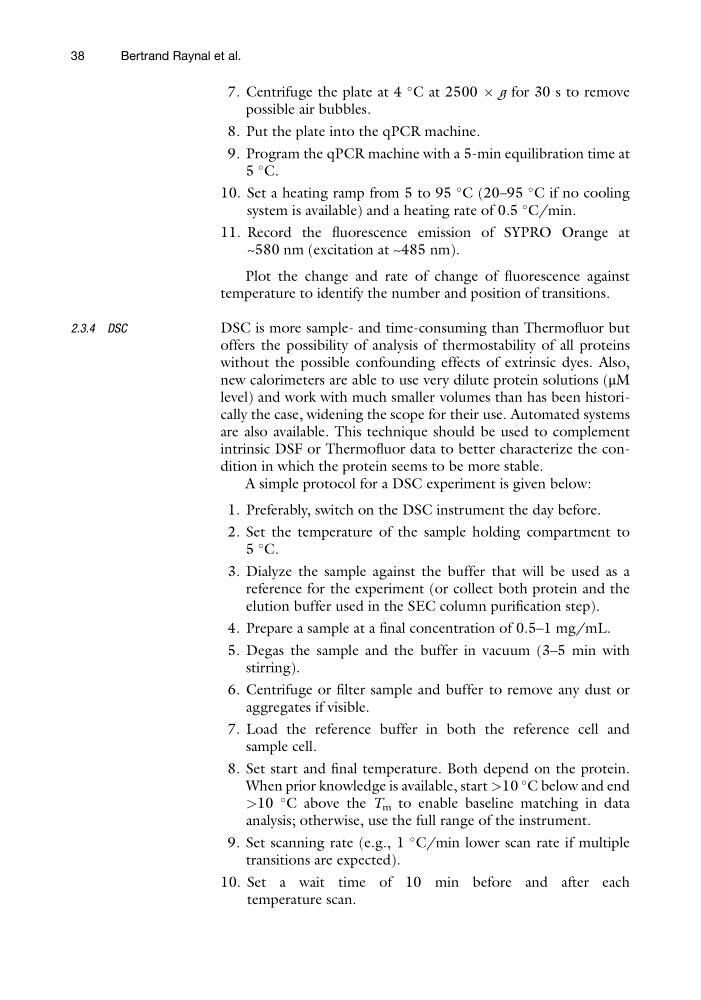
7. Centrifuge the plate at 4
C at 2500 Â g for 30 s to remove
possible air bubbles.
8. Put the plate into the qPCR machine.
9. Program the qPCR machine with a 5-min equilibration time at
5
C.
10. Set a heating ramp from 5 to 95
C (20–95
C if no cooling
system is available) and a heating rate of 0.5
C/min.
11. Record the fluorescence emission of SYPRO Orange at
~580 nm (excitation at ~485 nm).
Plot the change and rate of change of fluorescence against
temperature to identify the number and position of transitions.
2.3.4 DSC
DSC is more sample- and time-consuming than Thermofluor but
offers the possibility of analysis of thermostability of all proteins
without the possible confounding effects of extrinsic dyes. Also,
new calorimeters are able to use very dilute protein solutions (μM
level) and work with much smaller volumes than has been historically the case, widening the scope for their use. Automated systems
are also available. This technique should be used to complement
intrinsic DSF or Thermofluor data to better characterize the condition in which the protein seems to be more stable.
A simple protocol for a DSC experiment is given below:
1. Preferably, switch on the DSC instrument the day before.
2. Set the temperature of the sample holding compartment to
5
C.
3. Dialyze the sample against the buffer that will be used as a
reference for the experiment (or collect both protein and the
elution buffer used in the SEC column purification step).
4. Prepare a sample at a final concentration of 0.5–1 mg/mL.
5. Degas the sample and the buffer in vacuum (3–5 min with
stirring).
6. Centrifuge or filter sample and buffer to remove any dust or
aggregates if visible.
7. Load the reference buffer in both the reference cell and
sample cell.
8. Set start and final temperature. Both depend on the protein.
When prior knowledge is available, start >10
C below and end
>10
C above the T m to enable baseline matching in data
analysis; otherwise, use the full range of the instrument.
9. Set scanning rate (e.g., 1
C/min lower scan rate if multiple
transitions are expected).
10. Set a wait time of 10 min before and after each
temperature scan.
38
Bertrand Raynal et al.
C at 2500 Â g for 30 s to remove
possible air bubbles.
8. Put the plate into the qPCR machine.
9. Program the qPCR machine with a 5-min equilibration time at
5
C.
10. Set a heating ramp from 5 to 95
C (20–95
C if no cooling
system is available) and a heating rate of 0.5
C/min.
11. Record the fluorescence emission of SYPRO Orange at
~580 nm (excitation at ~485 nm).
Plot the change and rate of change of fluorescence against
temperature to identify the number and position of transitions.
2.3.4 DSC
DSC is more sample- and time-consuming than Thermofluor but
offers the possibility of analysis of thermostability of all proteins
without the possible confounding effects of extrinsic dyes. Also,
new calorimeters are able to use very dilute protein solutions (μM
level) and work with much smaller volumes than has been historically the case, widening the scope for their use. Automated systems
are also available. This technique should be used to complement
intrinsic DSF or Thermofluor data to better characterize the condition in which the protein seems to be more stable.
A simple protocol for a DSC experiment is given below:
1. Preferably, switch on the DSC instrument the day before.
2. Set the temperature of the sample holding compartment to
5
C.
3. Dialyze the sample against the buffer that will be used as a
reference for the experiment (or collect both protein and the
elution buffer used in the SEC column purification step).
4. Prepare a sample at a final concentration of 0.5–1 mg/mL.
5. Degas the sample and the buffer in vacuum (3–5 min with
stirring).
6. Centrifuge or filter sample and buffer to remove any dust or
aggregates if visible.
7. Load the reference buffer in both the reference cell and
sample cell.
8. Set start and final temperature. Both depend on the protein.
When prior knowledge is available, start >10
C below and end
>10
C above the T m to enable baseline matching in data
analysis; otherwise, use the full range of the instrument.
9. Set scanning rate (e.g., 1
C/min lower scan rate if multiple
transitions are expected).
10. Set a wait time of 10 min before and after each
temperature scan.
38
Bertrand Raynal et al.