

MSDVA I VKEG WL HKR GEYI K T WRPR YF L L K NDGT F I GYKE RPQDV DQREA PL NNF SVAQC QL MKT ERPRP NT F I I RCL QW T T VI E RT F HV ET PEE REEWT T AI QT VADGL KKQEE EEMDF RSGSP SDNSG AEEME VSL AK PKHRV T MNEF EYL KL L GKGT
F GKVI L VKEK AT GRY YAMKI L KKEV I VAKD EVAHT L T ENR VL QNS RHPF L T AL KY SF QT H DRL CF VMEYA NGGEL F F HL S RERVF SEDRA RF YGA EI VSA L DYL H SEKNV VYRDL KL ENL ML DKD GHI KI T DF GL CKEGI KDGAT MKT F C GT PEY L APEV
L EDND YGRAV DWWGL GVVMY EMMCG RL PF Y NQDHE KL F EL I L MEE I RF PR T L GPE AKSL L SGL L K KDPKQ RL GGG SEDAK EI MQH RF F AG I VWQH VYEKK L SPPF KPQVT SET DT RYF DE EF T AQ MI T I T PPDQD DSMEC VDSER RPHF P QF SYS ASGT A
1
161
321
10
20
30
40
50
60
70
80
90
100
110
120
130
140
150
160
170
180
190
200
210
220
230
240
250
260
270
280
290
300
310
320
330
340
350
360
370
380
390
400
410
420
430
440
450
460
470
480
3s
30s
300s
3000s
a
b
PH
kinase
Akt (soluble vs PIP3-bound)
296-321
358-362
78-95
36-55
protection
deprotection
> 10
7 - 10
decrease increase
no coverage
7 - 10
> 10
-7 - 7
-7 - 7
PH Domain: 78-95
1 10 100 1000 10000
0
20
40
60
80
% Relative Deuterium
Incorporation
PH Domain: 36-55
1 10 100 1000 10000
0
20
40
60
80
HDX Exchange Time (s)
Kinase C-lobe: 358-362
1 10 100 1000 10000
0
20
40
60
80
100
Activation Loop: 296-321
1 10 100 1000 10000
0
20
40
60
80
Akt1 Apo
Akt1+ Vesicles
e
Akt1 Apo
Akt1 + Mem
3s
30s
300s
3000s
< 10%
< 20%
< 30%
< 40%
< 50%
< 60%
< 70%
< 80%
< 90%
> 90%
no
coverage
% Deuterium Incorporation
PH Domain
Kinase Domain
1
480
Akt1
200
400
-100
-50
0
50
100
Relative % D
3 s
30 s
300 s
3000 s
Apo
Membrane
200
400
-40
-20
0
20
40
Relative %D difference
d
c
Decreased exchange with membrane binding
Increased exchange with membrane binding
3 s
30 s
300 s
3000 s
f
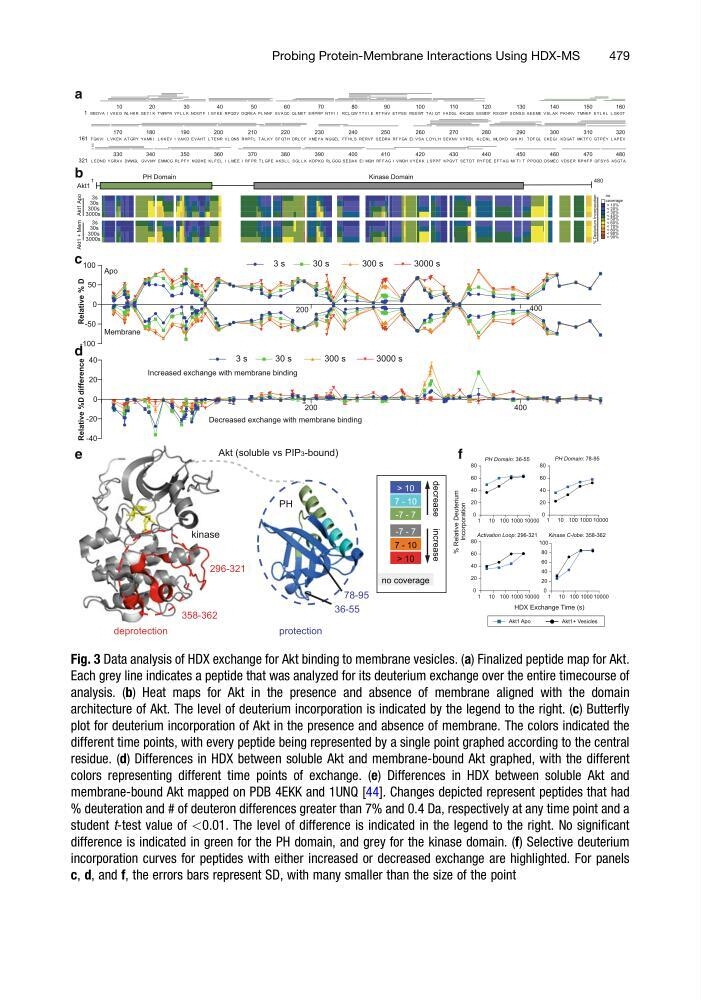
Fig. 3 Data analysis of HDX exchange for Akt binding to membrane vesicles. (a) Finalized peptide map for Akt.
Each grey line indicates a peptide that was analyzed for its deuterium exchange over the entire timecourse of
analysis. (b) Heat maps for Akt in the presence and absence of membrane aligned with the domain
architecture of Akt. The level of deuterium incorporation is indicated by the legend to the right. (c) Butterfly
plot for deuterium incorporation of Akt in the presence and absence of membrane. The colors indicated the
different time points, with every peptide being represented by a single point graphed according to the central
residue. (d) Differences in HDX between soluble Akt and membrane-bound Akt graphed, with the different
colors representing different time points of exchange. (e) Differences in HDX between soluble Akt and
membrane-bound Akt mapped on PDB 4EKK and 1UNQ [44]. Changes depicted represent peptides that had
% deuteration and # of deuteron differences greater than 7% and 0.4 Da, respectively at any time point and a
student t-test value of <0.01. The level of difference is indicated in the legend to the right. No significant
difference is indicated in green for the PH domain, and grey for the kinase domain. (f) Selective deuterium
incorporation curves for peptides with either increased or decreased exchange are highlighted. For panels
c, d, and f, the errors bars represent SD, with many smaller than the size of the point
Probing Protein-Membrane Interactions Using HDX-MS
479
F GKVI L VKEK AT GRY YAMKI L KKEV I VAKD EVAHT L T ENR VL QNS RHPF L T AL KY SF QT H DRL CF VMEYA NGGEL F F HL S RERVF SEDRA RF YGA EI VSA L DYL H SEKNV VYRDL KL ENL ML DKD GHI KI T DF GL CKEGI KDGAT MKT F C GT PEY L APEV
L EDND YGRAV DWWGL GVVMY EMMCG RL PF Y NQDHE KL F EL I L MEE I RF PR T L GPE AKSL L SGL L K KDPKQ RL GGG SEDAK EI MQH RF F AG I VWQH VYEKK L SPPF KPQVT SET DT RYF DE EF T AQ MI T I T PPDQD DSMEC VDSER RPHF P QF SYS ASGT A
1
161
321
10
20
30
40
50
60
70
80
90
100
110
120
130
140
150
160
170
180
190
200
210
220
230
240
250
260
270
280
290
300
310
320
330
340
350
360
370
380
390
400
410
420
430
440
450
460
470
480
3s
30s
300s
3000s
a
b
PH
kinase
Akt (soluble vs PIP3-bound)
296-321
358-362
78-95
36-55
protection
deprotection
> 10
7 - 10
decrease increase
no coverage
7 - 10
> 10
-7 - 7
-7 - 7
PH Domain: 78-95
1 10 100 1000 10000
0
20
40
60
80
% Relative Deuterium
Incorporation
PH Domain: 36-55
1 10 100 1000 10000
0
20
40
60
80
HDX Exchange Time (s)
Kinase C-lobe: 358-362
1 10 100 1000 10000
0
20
40
60
80
100
Activation Loop: 296-321
1 10 100 1000 10000
0
20
40
60
80
Akt1 Apo
Akt1+ Vesicles
e
Akt1 Apo
Akt1 + Mem
3s
30s
300s
3000s
< 10%
< 20%
< 30%
< 40%
< 50%
< 60%
< 70%
< 80%
< 90%
> 90%
no
coverage
% Deuterium Incorporation
PH Domain
Kinase Domain
1
480
Akt1
200
400
-100
-50
0
50
100
Relative % D
3 s
30 s
300 s
3000 s
Apo
Membrane
200
400
-40
-20
0
20
40
Relative %D difference
d
c
Decreased exchange with membrane binding
Increased exchange with membrane binding
3 s
30 s
300 s
3000 s
f
Fig. 3 Data analysis of HDX exchange for Akt binding to membrane vesicles. (a) Finalized peptide map for Akt.
Each grey line indicates a peptide that was analyzed for its deuterium exchange over the entire timecourse of
analysis. (b) Heat maps for Akt in the presence and absence of membrane aligned with the domain
architecture of Akt. The level of deuterium incorporation is indicated by the legend to the right. (c) Butterfly
plot for deuterium incorporation of Akt in the presence and absence of membrane. The colors indicated the
different time points, with every peptide being represented by a single point graphed according to the central
residue. (d) Differences in HDX between soluble Akt and membrane-bound Akt graphed, with the different
colors representing different time points of exchange. (e) Differences in HDX between soluble Akt and
membrane-bound Akt mapped on PDB 4EKK and 1UNQ [44]. Changes depicted represent peptides that had
% deuteration and # of deuteron differences greater than 7% and 0.4 Da, respectively at any time point and a
student t-test value of <0.01. The level of difference is indicated in the legend to the right. No significant
difference is indicated in green for the PH domain, and grey for the kinase domain. (f) Selective deuterium
incorporation curves for peptides with either increased or decreased exchange are highlighted. For panels
c, d, and f, the errors bars represent SD, with many smaller than the size of the point
Probing Protein-Membrane Interactions Using HDX-MS
479