

Nonlinear regression analysis of R eq values obtained at a series
of protein concentrations should therefore yield estimates of K d
and R max .
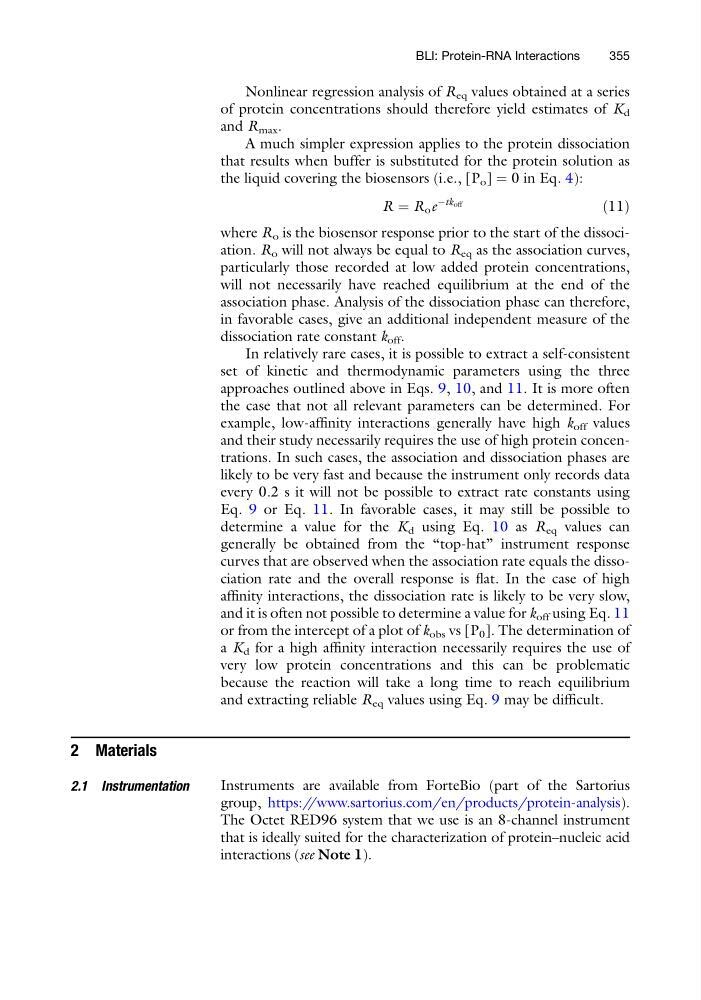
A much simpler expression applies to the protein dissociation
that results when buffer is substituted for the protein solution as
the liquid covering the biosensors (i.e., [P o ] ¼ 0 in Eq. 4):
R ¼ R o e
Àtk off
ð11Þ
where R o is the biosensor response prior to the start of the dissociation. R o will not always be equal to R eq as the association curves,
particularly those recorded at low added protein concentrations,
will not necessarily have reached equilibrium at the end of the
association phase. Analysis of the dissociation phase can therefore,
in favorable cases, give an additional independent measure of the
dissociation rate constant k off .
In relatively rare cases, it is possible to extract a self-consistent
set of kinetic and thermodynamic parameters using the three
approaches outlined above in Eqs. 9, 10, and 11. It is more often
the case that not all relevant parameters can be determined. For
example, low-affinity interactions generally have high k off values
and their study necessarily requires the use of high protein concentrations. In such cases, the association and dissociation phases are
likely to be very fast and because the instrument only records data
every 0.2 s it will not be possible to extract rate constants using
Eq. 9 or Eq. 11. In favorable cases, it may still be possible to
determine a value for the K d using Eq. 10 as R eq values can
generally be obtained from the “top-hat” instrument response
curves that are observed when the association rate equals the dissociation rate and the overall response is flat. In the case of high
affinity interactions, the dissociation rate is likely to be very slow,
and it is often not possible to determine a value for k off using Eq. 11
or from the intercept of a plot of k obs vs [P 0 ]. The determination of
a K d for a high affinity interaction necessarily requires the use of
very low protein concentrations and this can be problematic
because the reaction will take a long time to reach equilibrium
and extracting reliable R eq values using Eq. 9 may be difficult.
2 Materials
2.1 Instrumentation
Instruments are available from ForteBio (part of the Sartorius
group, https://www.sartorius.com/en/products/protein-analysis).
The Octet RED96 system that we use is an 8-channel instrument
that is ideally suited for the characterization of protein–nucleic acid
interactions (see Note 1).
BLI: Protein-RNA Interactions
355
of protein concentrations should therefore yield estimates of K d
and R max .
A much simpler expression applies to the protein dissociation
that results when buffer is substituted for the protein solution as
the liquid covering the biosensors (i.e., [P o ] ¼ 0 in Eq. 4):
R ¼ R o e
Àtk off
ð11Þ
where R o is the biosensor response prior to the start of the dissociation. R o will not always be equal to R eq as the association curves,
particularly those recorded at low added protein concentrations,
will not necessarily have reached equilibrium at the end of the
association phase. Analysis of the dissociation phase can therefore,
in favorable cases, give an additional independent measure of the
dissociation rate constant k off .
In relatively rare cases, it is possible to extract a self-consistent
set of kinetic and thermodynamic parameters using the three
approaches outlined above in Eqs. 9, 10, and 11. It is more often
the case that not all relevant parameters can be determined. For
example, low-affinity interactions generally have high k off values
and their study necessarily requires the use of high protein concentrations. In such cases, the association and dissociation phases are
likely to be very fast and because the instrument only records data
every 0.2 s it will not be possible to extract rate constants using
Eq. 9 or Eq. 11. In favorable cases, it may still be possible to
determine a value for the K d using Eq. 10 as R eq values can
generally be obtained from the “top-hat” instrument response
curves that are observed when the association rate equals the dissociation rate and the overall response is flat. In the case of high
affinity interactions, the dissociation rate is likely to be very slow,
and it is often not possible to determine a value for k off using Eq. 11
or from the intercept of a plot of k obs vs [P 0 ]. The determination of
a K d for a high affinity interaction necessarily requires the use of
very low protein concentrations and this can be problematic
because the reaction will take a long time to reach equilibrium
and extracting reliable R eq values using Eq. 9 may be difficult.
2 Materials
2.1 Instrumentation
Instruments are available from ForteBio (part of the Sartorius
group, https://www.sartorius.com/en/products/protein-analysis).
The Octet RED96 system that we use is an 8-channel instrument
that is ideally suited for the characterization of protein–nucleic acid
interactions (see Note 1).
BLI: Protein-RNA Interactions
355