

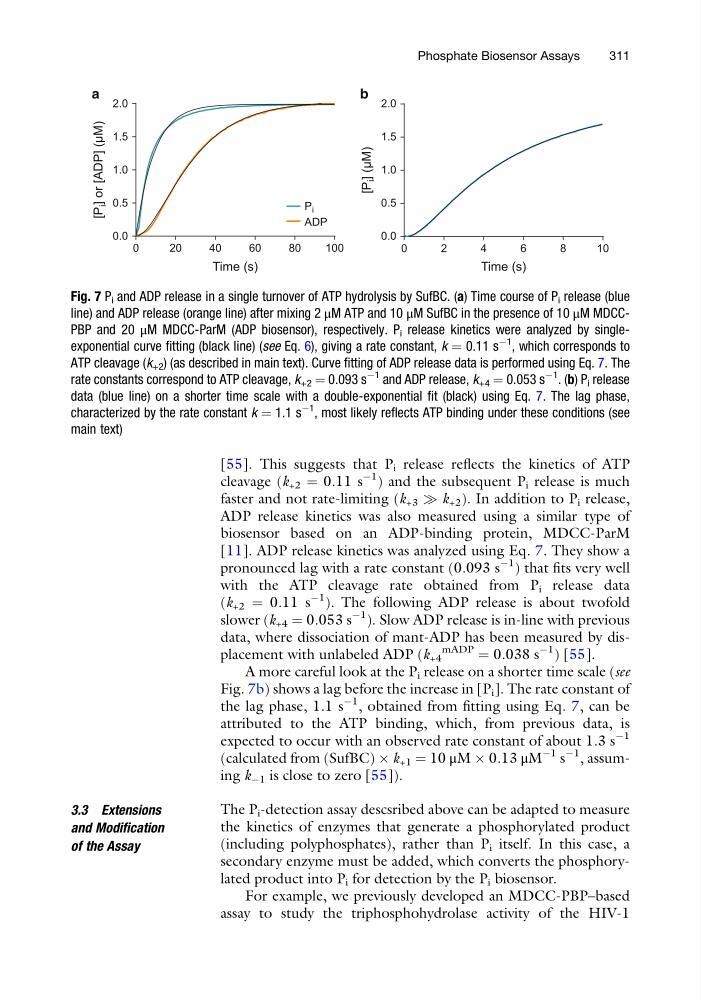
[55]. This suggests that P i release reflects the kinetics of ATP
cleavage (k +2 ¼ 0.11 s
À1 ) and the subsequent P i release is much
faster and not rate-limiting (k +3 ) k +2 ). In addition to P i release,
ADP release kinetics was also measured using a similar type of
biosensor based on an ADP-binding protein, MDCC-ParM
[11]. ADP release kinetics was analyzed using Eq. 7. They show a
pronounced lag with a rate constant (0.093 s
À1 ) that fits very well
with the ATP cleavage rate obtained from P i release data
(k +2 ¼ 0.11 s
À1
). The following ADP release is about twofold
slower (k +4 ¼ 0.053 s
À1
). Slow ADP release is in-line with previous
data, where dissociation of mant-ADP has been measured by displacement with unlabeled ADP (k +4
mADP
¼ 0.038 s
À1 ) [55].
A more careful look at the P i release on a shorter time scale (see
Fig. 7b) shows a lag before the increase in [P i ]. The rate constant of
the lag phase, 1.1 s
À1 , obtained from fitting using Eq. 7, can be
attributed to the ATP binding, which, from previous data, is
expected to occur with an observed rate constant of about 1.3 s
À1
(calculated from (SufBC) Â k +1 ¼ 10 μM Â 0.13 μM
À1 s
À1 , assuming k À1 is close to zero [55]).
3.3 Extensions
and Modification
of the Assay
The P i -detection assay descsribed above can be adapted to measure
the kinetics of enzymes that generate a phosphorylated product
(including polyphosphates), rather than P i itself. In this case, a
secondary enzyme must be added, which converts the phosphorylated product into P i for detection by the P i biosensor.
For example, we previously developed an MDCC-PBP–based
assay to study the triphosphohydrolase activity of the HIV-1
100
80
60
40
20
0
Time (s)
[P
i ] or [ADP] (µM)
ADP
P i
10
8
6
4
2
0
0.0
0.5
1.0
1.5
2.0
0.0
0.5
1.0
1.5
2.0
Time (s)
[P
i ] (µM)
a
b
Fig. 7 P i and ADP release in a single turnover of ATP hydrolysis by SufBC. (a) Time course of P i release (blue
line) and ADP release (orange line) after mixing 2 μM ATP and 10 μM SufBC in the presence of 10 μM MDCCPBP and 20 μM MDCC-ParM (ADP biosensor), respectively. P i release kinetics were analyzed by singleexponential curve fitting (black line) (see Eq. 6), giving a rate constant, k ¼ 0.11 s
À1
, which corresponds to
ATP cleavage (k +2 ) (as described in main text). Curve fitting of ADP release data is performed using Eq. 7. The
rate constants correspond to ATP cleavage, k +2 ¼ 0.093 s
À1
and ADP release, k +4 ¼ 0.053 s
À1
. (b) P i release
data (blue line) on a shorter time scale with a double-exponential fit (black) using Eq. 7. The lag phase,
characterized by the rate constant k ¼ 1.1 s
À1 , most likely reflects ATP binding under these conditions (see
main text)
Phosphate Biosensor Assays
311
cleavage (k +2 ¼ 0.11 s
À1 ) and the subsequent P i release is much
faster and not rate-limiting (k +3 ) k +2 ). In addition to P i release,
ADP release kinetics was also measured using a similar type of
biosensor based on an ADP-binding protein, MDCC-ParM
[11]. ADP release kinetics was analyzed using Eq. 7. They show a
pronounced lag with a rate constant (0.093 s
À1 ) that fits very well
with the ATP cleavage rate obtained from P i release data
(k +2 ¼ 0.11 s
À1
). The following ADP release is about twofold
slower (k +4 ¼ 0.053 s
À1
). Slow ADP release is in-line with previous
data, where dissociation of mant-ADP has been measured by displacement with unlabeled ADP (k +4
mADP
¼ 0.038 s
À1 ) [55].
A more careful look at the P i release on a shorter time scale (see
Fig. 7b) shows a lag before the increase in [P i ]. The rate constant of
the lag phase, 1.1 s
À1 , obtained from fitting using Eq. 7, can be
attributed to the ATP binding, which, from previous data, is
expected to occur with an observed rate constant of about 1.3 s
À1
(calculated from (SufBC) Â k +1 ¼ 10 μM Â 0.13 μM
À1 s
À1 , assuming k À1 is close to zero [55]).
3.3 Extensions
and Modification
of the Assay
The P i -detection assay descsribed above can be adapted to measure
the kinetics of enzymes that generate a phosphorylated product
(including polyphosphates), rather than P i itself. In this case, a
secondary enzyme must be added, which converts the phosphorylated product into P i for detection by the P i biosensor.
For example, we previously developed an MDCC-PBP–based
assay to study the triphosphohydrolase activity of the HIV-1
100
80
60
40
20
0
Time (s)
[P
i ] or [ADP] (µM)
ADP
P i
10
8
6
4
2
0
0.0
0.5
1.0
1.5
2.0
0.0
0.5
1.0
1.5
2.0
Time (s)
[P
i ] (µM)
a
b
Fig. 7 P i and ADP release in a single turnover of ATP hydrolysis by SufBC. (a) Time course of P i release (blue
line) and ADP release (orange line) after mixing 2 μM ATP and 10 μM SufBC in the presence of 10 μM MDCCPBP and 20 μM MDCC-ParM (ADP biosensor), respectively. P i release kinetics were analyzed by singleexponential curve fitting (black line) (see Eq. 6), giving a rate constant, k ¼ 0.11 s
À1
, which corresponds to
ATP cleavage (k +2 ) (as described in main text). Curve fitting of ADP release data is performed using Eq. 7. The
rate constants correspond to ATP cleavage, k +2 ¼ 0.093 s
À1
and ADP release, k +4 ¼ 0.053 s
À1
. (b) P i release
data (blue line) on a shorter time scale with a double-exponential fit (black) using Eq. 7. The lag phase,
characterized by the rate constant k ¼ 1.1 s
À1 , most likely reflects ATP binding under these conditions (see
main text)
Phosphate Biosensor Assays
311