

P i
300
400
500
600
0
400
800
1200
Wavelength (nm)
Fluorescence (a.u.)
427
466
+ P i
+ P i mop
- P i
a
b
Cys 197
Cys 197
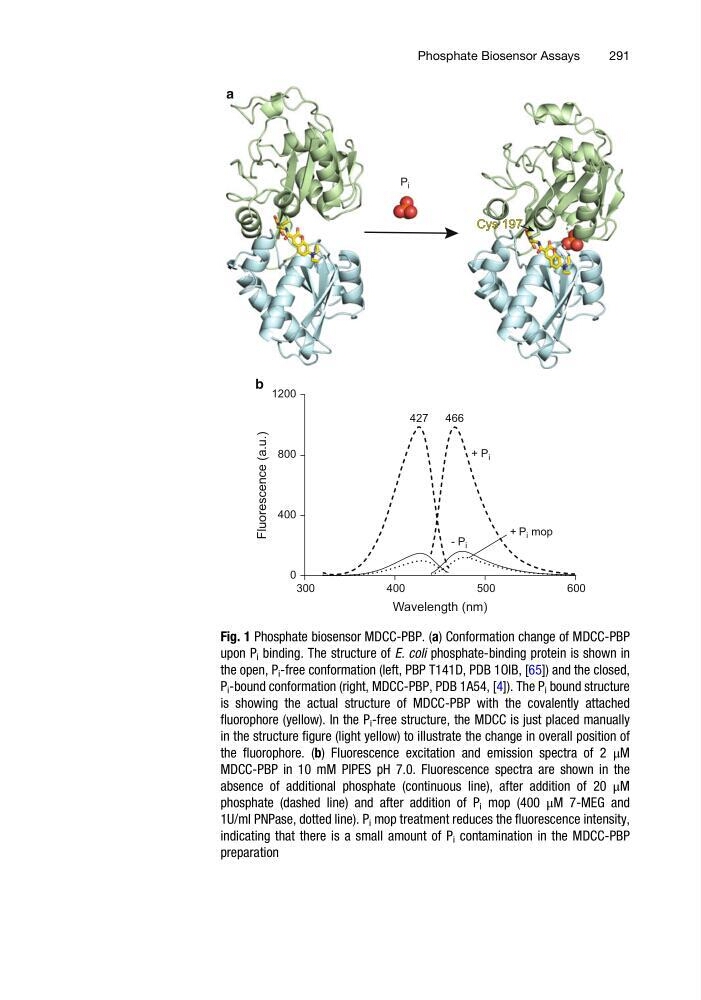
Fig. 1 Phosphate biosensor MDCC-PBP. (a) Conformation change of MDCC-PBP
upon P i binding. The structure of E. coli phosphate-binding protein is shown in
the open, P i -free conformation (left, PBP T141D, PDB 1OIB, [65]) and the closed,
P i -bound conformation (right, MDCC-PBP, PDB 1A54, [4]). The P i bound structure
is showing the actual structure of MDCC-PBP with the covalently attached
fluorophore (yellow). In the P i -free structure, the MDCC is just placed manually
in the structure figure (light yellow) to illustrate the change in overall position of
the fluorophore. (b) Fluorescence excitation and emission spectra of 2 μM
MDCC-PBP in 10 mM PIPES pH 7.0. Fluorescence spectra are shown in the
absence of additional phosphate (continuous line), after addition of 20 μM
phosphate (dashed line) and after addition of P i mop (400 μM 7-MEG and
1U/ml PNPase, dotted line). P i mop treatment reduces the fluorescence intensity,
indicating that there is a small amount of P i contamination in the MDCC-PBP
preparation
Phosphate Biosensor Assays
291
300
400
500
600
0
400
800
1200
Wavelength (nm)
Fluorescence (a.u.)
427
466
+ P i
+ P i mop
- P i
a
b
Cys 197
Cys 197
Fig. 1 Phosphate biosensor MDCC-PBP. (a) Conformation change of MDCC-PBP
upon P i binding. The structure of E. coli phosphate-binding protein is shown in
the open, P i -free conformation (left, PBP T141D, PDB 1OIB, [65]) and the closed,
P i -bound conformation (right, MDCC-PBP, PDB 1A54, [4]). The P i bound structure
is showing the actual structure of MDCC-PBP with the covalently attached
fluorophore (yellow). In the P i -free structure, the MDCC is just placed manually
in the structure figure (light yellow) to illustrate the change in overall position of
the fluorophore. (b) Fluorescence excitation and emission spectra of 2 μM
MDCC-PBP in 10 mM PIPES pH 7.0. Fluorescence spectra are shown in the
absence of additional phosphate (continuous line), after addition of 20 μM
phosphate (dashed line) and after addition of P i mop (400 μM 7-MEG and
1U/ml PNPase, dotted line). P i mop treatment reduces the fluorescence intensity,
indicating that there is a small amount of P i contamination in the MDCC-PBP
preparation
Phosphate Biosensor Assays
291