

equations (Eqs. 8 and 9), Fl is the relative fluorescence at time
t, k app is the apparent rate constant, A 1 is the signal amplitude,
and Fl 1 is the final fluorescent signal. The two-exponential
equation has an additional exponential term to account for
the second apparent rate and the corresponding amplitude
change (denoted as A 2 and k app2 ).
Fl ¼ Fl 1 þ A 1 exp Àk app1 t
À
Á
ð8Þ
Fl ¼ Fl 1 þ A 1 exp Àk app1 t
À
Á þ A 2 exp Àk app2 t
À
Á
ð9Þ
2. Average all traces that have similar values for each variable from
the individual fits. Aim to average as few traces as possible
(up to 10 is a typical number for a smaller signal change).
3. Repeat experiment for additional ligand concentrations to
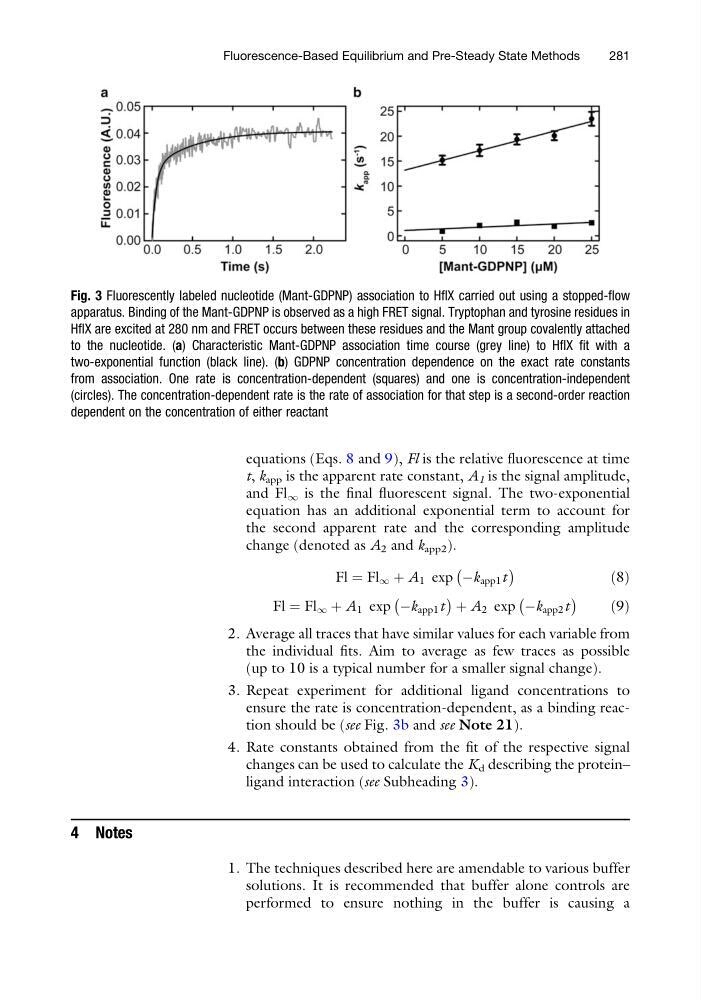
ensure the rate is concentration-dependent, as a binding reaction should be (see Fig. 3b and see Note 21).
4. Rate constants obtained from the fit of the respective signal
changes can be used to calculate the K d describing the protein–
ligand interaction (see Subheading 3).
4 Notes
1. The techniques described here are amendable to various buffer
solutions. It is recommended that buffer alone controls are
performed to ensure nothing in the buffer is causing a
Fig. 3 Fluorescently labeled nucleotide (Mant-GDPNP) association to HflX carried out using a stopped-flow
apparatus. Binding of the Mant-GDPNP is observed as a high FRET signal. Tryptophan and tyrosine residues in
HflX are excited at 280 nm and FRET occurs between these residues and the Mant group covalently attached
to the nucleotide. (a) Characteristic Mant-GDPNP association time course (grey line) to HflX fit with a
two-exponential function (black line). (b) GDPNP concentration dependence on the exact rate constants
from association. One rate is concentration-dependent (squares) and one is concentration-independent
(circles). The concentration-dependent rate is the rate of association for that step is a second-order reaction
dependent on the concentration of either reactant
Fluorescence-Based Equilibrium and Pre-Steady State Methods
281
t, k app is the apparent rate constant, A 1 is the signal amplitude,
and Fl 1 is the final fluorescent signal. The two-exponential
equation has an additional exponential term to account for
the second apparent rate and the corresponding amplitude
change (denoted as A 2 and k app2 ).
Fl ¼ Fl 1 þ A 1 exp Àk app1 t
À
Á
ð8Þ
Fl ¼ Fl 1 þ A 1 exp Àk app1 t
À
Á þ A 2 exp Àk app2 t
À
Á
ð9Þ
2. Average all traces that have similar values for each variable from
the individual fits. Aim to average as few traces as possible
(up to 10 is a typical number for a smaller signal change).
3. Repeat experiment for additional ligand concentrations to
ensure the rate is concentration-dependent, as a binding reaction should be (see Fig. 3b and see Note 21).
4. Rate constants obtained from the fit of the respective signal
changes can be used to calculate the K d describing the protein–
ligand interaction (see Subheading 3).
4 Notes
1. The techniques described here are amendable to various buffer
solutions. It is recommended that buffer alone controls are
performed to ensure nothing in the buffer is causing a
Fig. 3 Fluorescently labeled nucleotide (Mant-GDPNP) association to HflX carried out using a stopped-flow
apparatus. Binding of the Mant-GDPNP is observed as a high FRET signal. Tryptophan and tyrosine residues in
HflX are excited at 280 nm and FRET occurs between these residues and the Mant group covalently attached
to the nucleotide. (a) Characteristic Mant-GDPNP association time course (grey line) to HflX fit with a
two-exponential function (black line). (b) GDPNP concentration dependence on the exact rate constants
from association. One rate is concentration-dependent (squares) and one is concentration-independent
(circles). The concentration-dependent rate is the rate of association for that step is a second-order reaction
dependent on the concentration of either reactant
Fluorescence-Based Equilibrium and Pre-Steady State Methods
281