

3. Read the plate to determine both the total fluorescence and the
polarization of free ligand.
4. Add the ligand to another ten wells on a black microtiter plate
and, to these wells, also add receptor to a final concentration
approximately equal to tenfold above the expected K d . Dilute
to the required assay volume with assay buffer.
5. Incubate for sufficient time to allow the binding reaction to
reach equilibrium (as determined in Subheading 3.3.3) and
measure total fluorescence and polarization. If total fluorescence changes by more than approximately threefold, a correction may be required. The values obtained in the experiments
above are used to correct the anisotropy (or polarization) value
obtained, employing the equation below [15]:
r c ¼
r À r f
ð
Þ= r b À r
ð
Þ
½
Q f =Q b
À
Á
r b
ð Þ
È
É þ r f
1 þ r À r f
ð
Þ= r b À r
ð
Þ Q f =Q b
À
Á
Â
Ã
ð4Þ
where r c is the corrected anisotropy, r is the measured
anisotropy, r f is the anisotropy of the ligand alone, r b is the
anisotropy of the ligand bound to the receptor ([receptor] ¼ 10 Â K d ), Q f is the total fluorescence of the ligand
alone, and Q b is the total fluorescence of the ligand bound to
the receptor ([receptor] ¼ 10 Â K d ).
This correction will be required for all subsequent readings and
is applicable for data that refer to anisotropy, but polarization values
may be substituted using Eq. 3 (see Note 11).
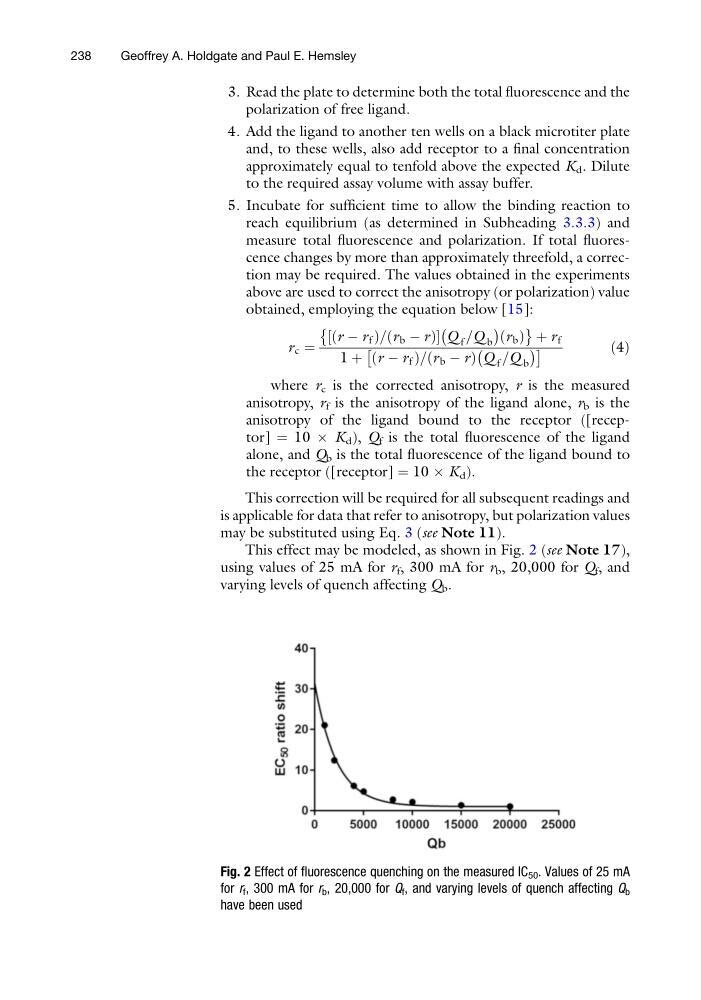
This effect may be modeled, as shown in Fig. 2 (see Note 17),
using values of 25 mA for r f , 300 mA for r b , 20,000 for Q f , and
varying levels of quench affecting Q b .
Fig. 2 Effect of fluorescence quenching on the measured IC 50 . Values of 25 mA
for r f , 300 mA for r b , 20,000 for Q f , and varying levels of quench affecting Q b
have been used
238
Geoffrey A. Holdgate and Paul E. Hemsley
polarization of free ligand.
4. Add the ligand to another ten wells on a black microtiter plate
and, to these wells, also add receptor to a final concentration
approximately equal to tenfold above the expected K d . Dilute
to the required assay volume with assay buffer.
5. Incubate for sufficient time to allow the binding reaction to
reach equilibrium (as determined in Subheading 3.3.3) and
measure total fluorescence and polarization. If total fluorescence changes by more than approximately threefold, a correction may be required. The values obtained in the experiments
above are used to correct the anisotropy (or polarization) value
obtained, employing the equation below [15]:
r c ¼
r À r f
ð
Þ= r b À r
ð
Þ
½
Q f =Q b
À
Á
r b
ð Þ
È
É þ r f
1 þ r À r f
ð
Þ= r b À r
ð
Þ Q f =Q b
À
Á
Â
Ã
ð4Þ
where r c is the corrected anisotropy, r is the measured
anisotropy, r f is the anisotropy of the ligand alone, r b is the
anisotropy of the ligand bound to the receptor ([receptor] ¼ 10 Â K d ), Q f is the total fluorescence of the ligand
alone, and Q b is the total fluorescence of the ligand bound to
the receptor ([receptor] ¼ 10 Â K d ).
This correction will be required for all subsequent readings and
is applicable for data that refer to anisotropy, but polarization values
may be substituted using Eq. 3 (see Note 11).
This effect may be modeled, as shown in Fig. 2 (see Note 17),
using values of 25 mA for r f , 300 mA for r b , 20,000 for Q f , and
varying levels of quench affecting Q b .
Fig. 2 Effect of fluorescence quenching on the measured IC 50 . Values of 25 mA
for r f , 300 mA for r b , 20,000 for Q f , and varying levels of quench affecting Q b
have been used
238
Geoffrey A. Holdgate and Paul E. Hemsley