

two reads. In this way, information about the mode of inhibition of
a compound can be obtained during the primary screen. It is
necessary to ensure that both sides of the reaction are able to
proceed even in the presence of an inhibitor of the other side;
hence, the substrates for both sides must be included in the assay
setup.
3.3 Screening
Biochemical assays for AMI-MS have a very simple setup, comprising addition of enzyme to an assay-ready compound plate, followed
by substrate addition, incubation at room temperature, and then
addition of a stop reagent, which is usually an acid such as formic or
acetic acid.
There is a range of methods for preparing compound assay
plates for screening, from using manual handheld pipettes through
to fully automated systems, providing that the concentrations of
compound and vehicle are within acceptable limits for assays.
Within AstraZeneca, a system of assay-ready plates (ARP) is used
for both high-throughput and concentration-response screening,
utilizing automated compound storage combined with acoustic
dispensing, to ensure the highest quality and reproducibility possible [12]. Test compounds are held in long-term automated storage
within a climate-controlled environment. After plating into master
plates, an Echo
® 555 acoustic dispenser (Labcyte, CA, USA) is used
to pre-dispense nanoliter volumes of compounds into assay plates
prior to the addition of reagents. This removes the need for extra
pre-dilution steps of compounds dissolved in 100% (v/v) DMSO
(see Note 7). Unless otherwise stated, all test compounds are
prepared in 100% (v/v) DMSO at 10 mM.
The volume of compound transferred to ARPs is assay dependent. For primary screening, each compound is tested once at a
single concentration (10 μM–100 μM, depending on the compound type). For concentration-response (CR) screening, each
compound is dispensed to create single 10-point curves. To ensure
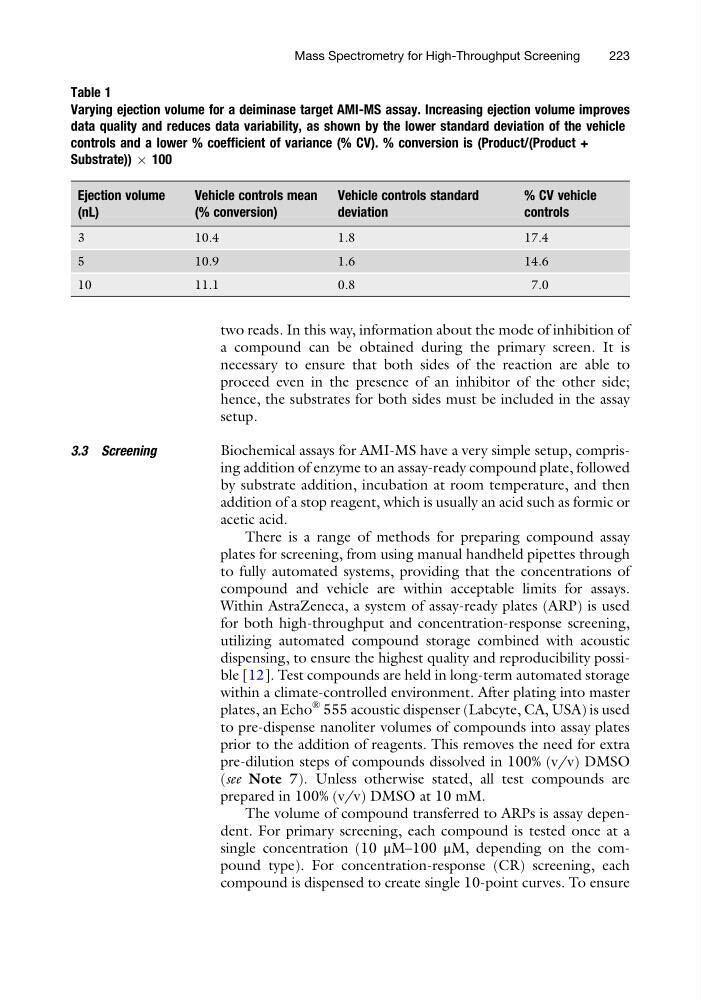
Table 1
Varying ejection volume for a deiminase target AMI-MS assay. Increasing ejection volume improves
data quality and reduces data variability, as shown by the lower standard deviation of the vehicle
controls and a lower % coefficient of variance (% CV). % conversion is (Product/(Product +
Substrate)) Â 100
Ejection volume
(nL)
Vehicle controls mean
(% conversion)
Vehicle controls standard
deviation
% CV vehicle
controls
3
10.4
1.8
17.4
5
10.9
1.6
14.6
10
11.1
0.8
7.0
Mass Spectrometry for High-Throughput Screening
223
a compound can be obtained during the primary screen. It is
necessary to ensure that both sides of the reaction are able to
proceed even in the presence of an inhibitor of the other side;
hence, the substrates for both sides must be included in the assay
setup.
3.3 Screening
Biochemical assays for AMI-MS have a very simple setup, comprising addition of enzyme to an assay-ready compound plate, followed
by substrate addition, incubation at room temperature, and then
addition of a stop reagent, which is usually an acid such as formic or
acetic acid.
There is a range of methods for preparing compound assay
plates for screening, from using manual handheld pipettes through
to fully automated systems, providing that the concentrations of
compound and vehicle are within acceptable limits for assays.
Within AstraZeneca, a system of assay-ready plates (ARP) is used
for both high-throughput and concentration-response screening,
utilizing automated compound storage combined with acoustic
dispensing, to ensure the highest quality and reproducibility possible [12]. Test compounds are held in long-term automated storage
within a climate-controlled environment. After plating into master
plates, an Echo
® 555 acoustic dispenser (Labcyte, CA, USA) is used
to pre-dispense nanoliter volumes of compounds into assay plates
prior to the addition of reagents. This removes the need for extra
pre-dilution steps of compounds dissolved in 100% (v/v) DMSO
(see Note 7). Unless otherwise stated, all test compounds are
prepared in 100% (v/v) DMSO at 10 mM.
The volume of compound transferred to ARPs is assay dependent. For primary screening, each compound is tested once at a
single concentration (10 μM–100 μM, depending on the compound type). For concentration-response (CR) screening, each
compound is dispensed to create single 10-point curves. To ensure
Table 1
Varying ejection volume for a deiminase target AMI-MS assay. Increasing ejection volume improves
data quality and reduces data variability, as shown by the lower standard deviation of the vehicle
controls and a lower % coefficient of variance (% CV). % conversion is (Product/(Product +
Substrate)) Â 100
Ejection volume
(nL)
Vehicle controls mean
(% conversion)
Vehicle controls standard
deviation
% CV vehicle
controls
3
10.4
1.8
17.4
5
10.9
1.6
14.6
10
11.1
0.8
7.0
Mass Spectrometry for High-Throughput Screening
223