

protein at the concentration determined in step 8 and add
10 μL to all wells of the 384-well PCR plate. If protein is
limiting, prepare 120–240 μL of protein in DSF buffer at the
concentration determined in step 8 and add to 10–20 wells
distributed across a 384-well PCR plate (e.g., A1, A9, A17,
A24, D4, D21, F17, G7, H1, H12, H13, I12, I13, I24, J17,
K7, M4, M21, P1, P9, P17, and P24).
10. Seal the plate with optical sealing film and centrifuge the plate
at 300 Â g for 1 min.
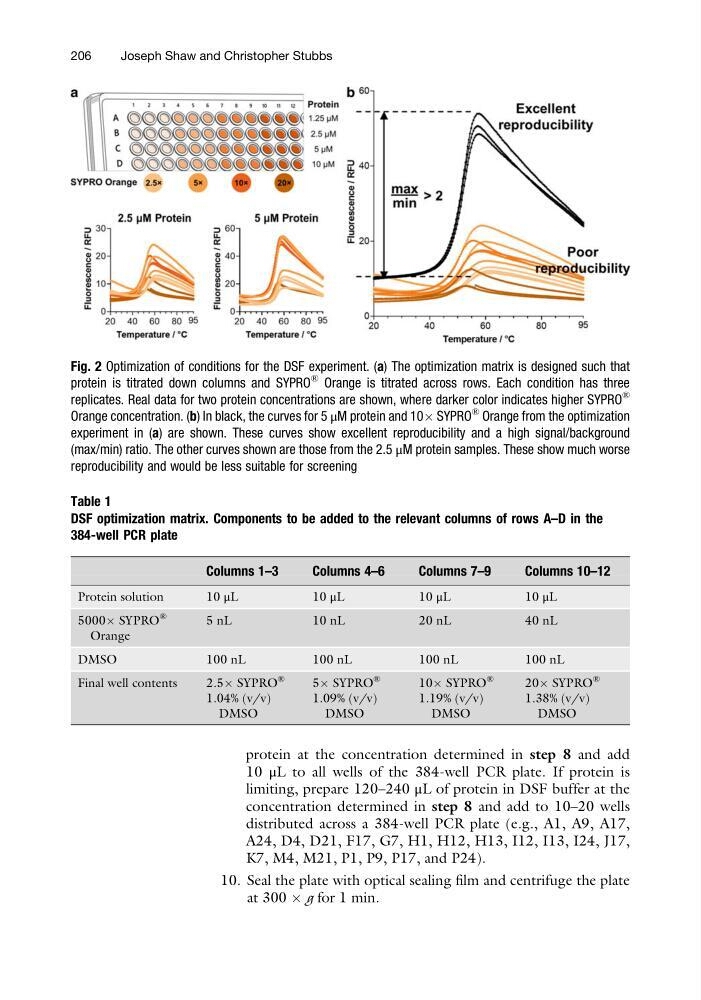
Fig. 2 Optimization of conditions for the DSF experiment. (a) The optimization matrix is designed such that
protein is titrated down columns and SYPRO
®
Orange is titrated across rows. Each condition has three
replicates. Real data for two protein concentrations are shown, where darker color indicates higher SYPRO
®
Orange concentration. (b) In black, the curves for 5 μM protein and 10Â SYPRO
®
Orange from the optimization
experiment in (a) are shown. These curves show excellent reproducibility and a high signal/background
(max/min) ratio. The other curves shown are those from the 2.5 μM protein samples. These show much worse
reproducibility and would be less suitable for screening
Table 1
DSF optimization matrix. Components to be added to the relevant columns of rows A–D in the
384-well PCR plate
Columns 1–3
Columns 4–6
Columns 7–9
Columns 10–12
Protein solution
10 μL
1 0 μL
1 0 μL
1 0 μL
5000Â SYPRO
®
Orange
5 nL
10 nL
20 nL
40 nL
DMSO
100 nL
100 nL
100 nL
100 nL
Final well contents
2.5Â SYPRO
®
1.04% (v/v)
DMSO
5Â SYPRO
®
1.09% (v/v)
DMSO
10Â SYPRO
®
1.19% (v/v)
DMSO
20Â SYPRO
®
1.38% (v/v)
DMSO
206
Joseph Shaw and Christopher Stubbs
10 μL to all wells of the 384-well PCR plate. If protein is
limiting, prepare 120–240 μL of protein in DSF buffer at the
concentration determined in step 8 and add to 10–20 wells
distributed across a 384-well PCR plate (e.g., A1, A9, A17,
A24, D4, D21, F17, G7, H1, H12, H13, I12, I13, I24, J17,
K7, M4, M21, P1, P9, P17, and P24).
10. Seal the plate with optical sealing film and centrifuge the plate
at 300 Â g for 1 min.
Fig. 2 Optimization of conditions for the DSF experiment. (a) The optimization matrix is designed such that
protein is titrated down columns and SYPRO
®
Orange is titrated across rows. Each condition has three
replicates. Real data for two protein concentrations are shown, where darker color indicates higher SYPRO
®
Orange concentration. (b) In black, the curves for 5 μM protein and 10Â SYPRO
®
Orange from the optimization
experiment in (a) are shown. These curves show excellent reproducibility and a high signal/background
(max/min) ratio. The other curves shown are those from the 2.5 μM protein samples. These show much worse
reproducibility and would be less suitable for screening
Table 1
DSF optimization matrix. Components to be added to the relevant columns of rows A–D in the
384-well PCR plate
Columns 1–3
Columns 4–6
Columns 7–9
Columns 10–12
Protein solution
10 μL
1 0 μL
1 0 μL
1 0 μL
5000Â SYPRO
®
Orange
5 nL
10 nL
20 nL
40 nL
DMSO
100 nL
100 nL
100 nL
100 nL
Final well contents
2.5Â SYPRO
®
1.04% (v/v)
DMSO
5Â SYPRO
®
1.09% (v/v)
DMSO
10Â SYPRO
®
1.19% (v/v)
DMSO
20Â SYPRO
®
1.38% (v/v)
DMSO
206
Joseph Shaw and Christopher Stubbs