

not likely to deleteriously affect the analysis or force the analysis
of the fluorescence alone, so the protocol proceeded.
6. Press the “Differential Bleach” button. This presents another
pre-IR phenomenon that is related to the rate of bleaching of
the illuminated fluorophore. Again, if there is a strong trend
here, it is preferable to analyze this signal over thermophoresis
(see Note 21). In the example case, although photobleaching is
evident, no trend in the differential bleach signal is present
(Fig. 4b), allowing analysis of post-IR phenomena.
7. Press the “Thermophoresis” button. This compares the fluorescence just after IR illumination and that just before IR
extinguishment. Examine the data; a strong trend here can be
analyzed. However, before using this signal for analysis, one
should perform the next step.
8. Press the “T-Jump” button. This compares the fluorescence
before IR actuation to that just after. In our experience, a
strong trend here should be analyzed over that in thermophoresis alone, as K D derived from T-Jump has yielded better
agreement with K D s derived from other biophysical techniques
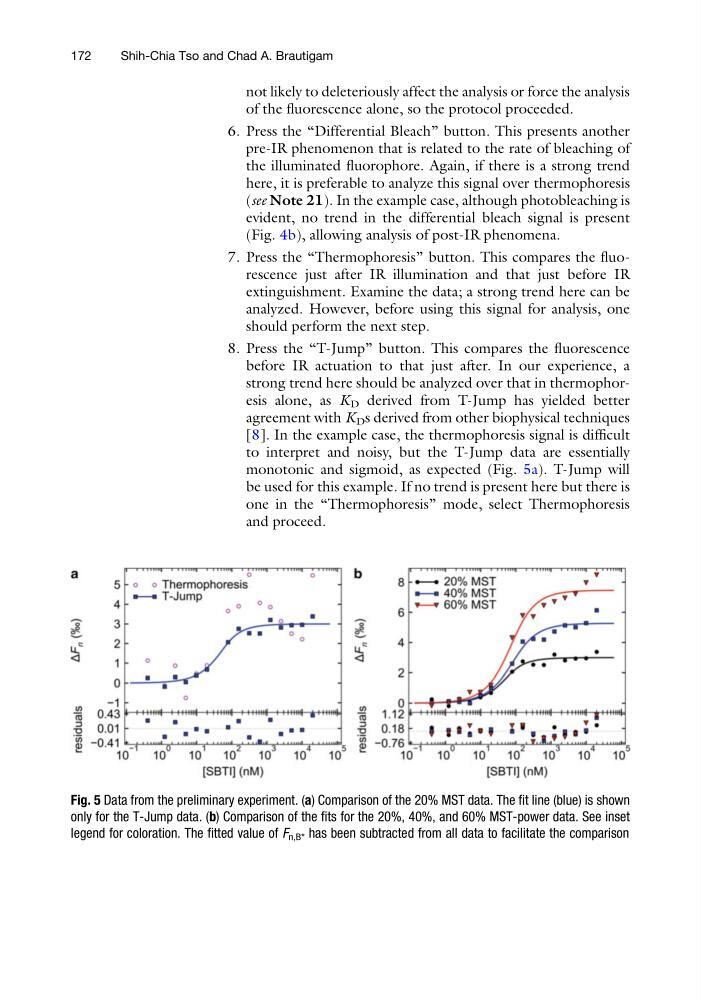
[8]. In the example case, the thermophoresis signal is difficult
to interpret and noisy, but the T-Jump data are essentially
monotonic and sigmoid, as expected (Fig. 5a). T-Jump will
be used for this example. If no trend is present here but there is
one in the “Thermophoresis” mode, select Thermophoresis
and proceed.
Fig. 5 Data from the preliminary experiment. (a) Comparison of the 20% MST data. The fit line (blue) is shown
only for the T-Jump data. (b) Comparison of the fits for the 20%, 40%, and 60% MST-power data. See inset
legend for coloration. The fitted value of F n,B* has been subtracted from all data to facilitate the comparison
172
Shih-Chia Tso and Chad A. Brautigam
of the fluorescence alone, so the protocol proceeded.
6. Press the “Differential Bleach” button. This presents another
pre-IR phenomenon that is related to the rate of bleaching of
the illuminated fluorophore. Again, if there is a strong trend
here, it is preferable to analyze this signal over thermophoresis
(see Note 21). In the example case, although photobleaching is
evident, no trend in the differential bleach signal is present
(Fig. 4b), allowing analysis of post-IR phenomena.
7. Press the “Thermophoresis” button. This compares the fluorescence just after IR illumination and that just before IR
extinguishment. Examine the data; a strong trend here can be
analyzed. However, before using this signal for analysis, one
should perform the next step.
8. Press the “T-Jump” button. This compares the fluorescence
before IR actuation to that just after. In our experience, a
strong trend here should be analyzed over that in thermophoresis alone, as K D derived from T-Jump has yielded better
agreement with K D s derived from other biophysical techniques
[8]. In the example case, the thermophoresis signal is difficult
to interpret and noisy, but the T-Jump data are essentially
monotonic and sigmoid, as expected (Fig. 5a). T-Jump will
be used for this example. If no trend is present here but there is
one in the “Thermophoresis” mode, select Thermophoresis
and proceed.
Fig. 5 Data from the preliminary experiment. (a) Comparison of the 20% MST data. The fit line (blue) is shown
only for the T-Jump data. (b) Comparison of the fits for the 20%, 40%, and 60% MST-power data. See inset
legend for coloration. The fitted value of F n,B* has been subtracted from all data to facilitate the comparison
172
Shih-Chia Tso and Chad A. Brautigam