

3.2 Data Inspection
and Fitting
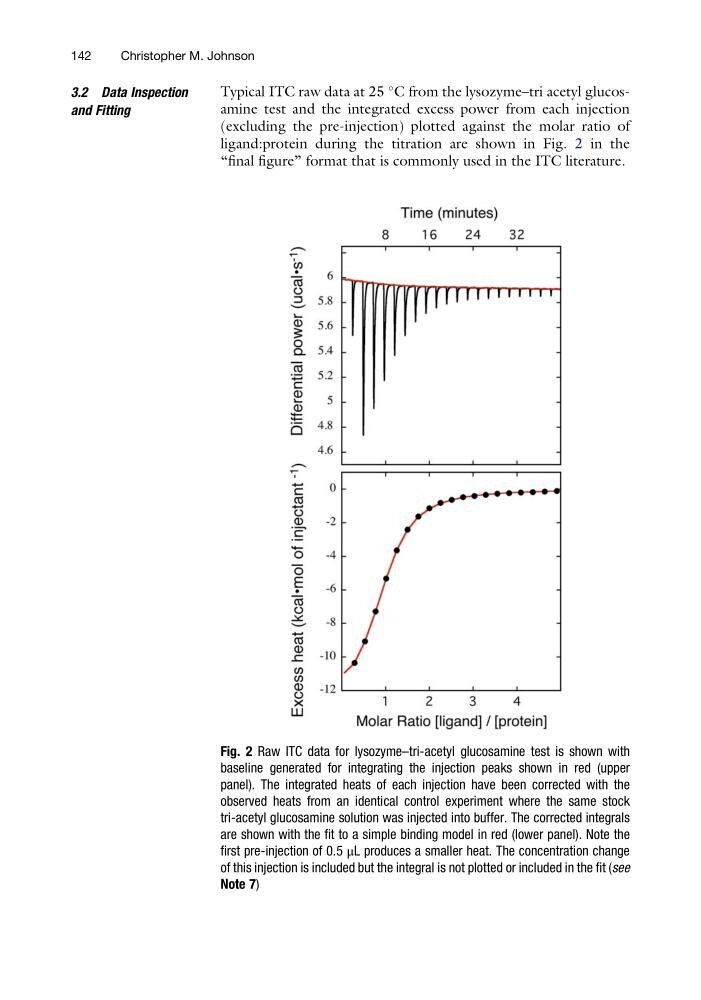
Typical ITC raw data at 25
C from the lysozyme–tri acetyl glucosamine test and the integrated excess power from each injection
(excluding the pre-injection) plotted against the molar ratio of
ligand:protein during the titration are shown in Fig. 2 in the
“final figure” format that is commonly used in the ITC literature.
Fig. 2 Raw ITC data for lysozyme–tri-acetyl glucosamine test is shown with
baseline generated for integrating the injection peaks shown in red (upper
panel). The integrated heats of each injection have been corrected with the
observed heats from an identical control experiment where the same stock
tri-acetyl glucosamine solution was injected into buffer. The corrected integrals
are shown with the fit to a simple binding model in red (lower panel). Note the
first pre-injection of 0.5 μL produces a smaller heat. The concentration change
of this injection is included but the integral is not plotted or included in the fit (see
Note 7)
142
Christopher M. Johnson
and Fitting
Typical ITC raw data at 25
C from the lysozyme–tri acetyl glucosamine test and the integrated excess power from each injection
(excluding the pre-injection) plotted against the molar ratio of
ligand:protein during the titration are shown in Fig. 2 in the
“final figure” format that is commonly used in the ITC literature.
Fig. 2 Raw ITC data for lysozyme–tri-acetyl glucosamine test is shown with
baseline generated for integrating the injection peaks shown in red (upper
panel). The integrated heats of each injection have been corrected with the
observed heats from an identical control experiment where the same stock
tri-acetyl glucosamine solution was injected into buffer. The corrected integrals
are shown with the fit to a simple binding model in red (lower panel). Note the
first pre-injection of 0.5 μL produces a smaller heat. The concentration change
of this injection is included but the integral is not plotted or included in the fit (see
Note 7)
142
Christopher M. Johnson