

applying its maximum electrical heating and a lower limit where
differential power reaches zero; beyond which the instrument
would require “cooling” at the sample cell.
Sequential injections of ligand from the syringe into the sample
cell produce endothermic or exothermic heat effects in the cell and
the instrument “compensates” by adjusting the differential power
via the feedback circuit for the duration of the effect. This maintains
the difference in temperature between sample and reference cell at
its fixed value. The differential power vs. time trace is characterized
by these peaks where the signal deflects from, and then returns to, a
baseline value as the reaction equilibrium is perturbed and then
reestablished. These “peaks” in differential power can be integrated
over time using baselines that are interpolated from levels before
and after each injection (see Note 5). It is this integral over time
(units of heat) normalized by the amount of injected ligand (units
of molar heat) that reflects heat of binding and the extent of the
protein–ligand complex formation once changes in the protein and
ligand concentration are accounted for and any corrections for
nonbinding contributions are made (see Note 6).
Typical experimental parameters involve using 15–20 equal
injections from the syringe. These are preceded by a smaller “preinjection” that eliminates material at the end of the needle that may
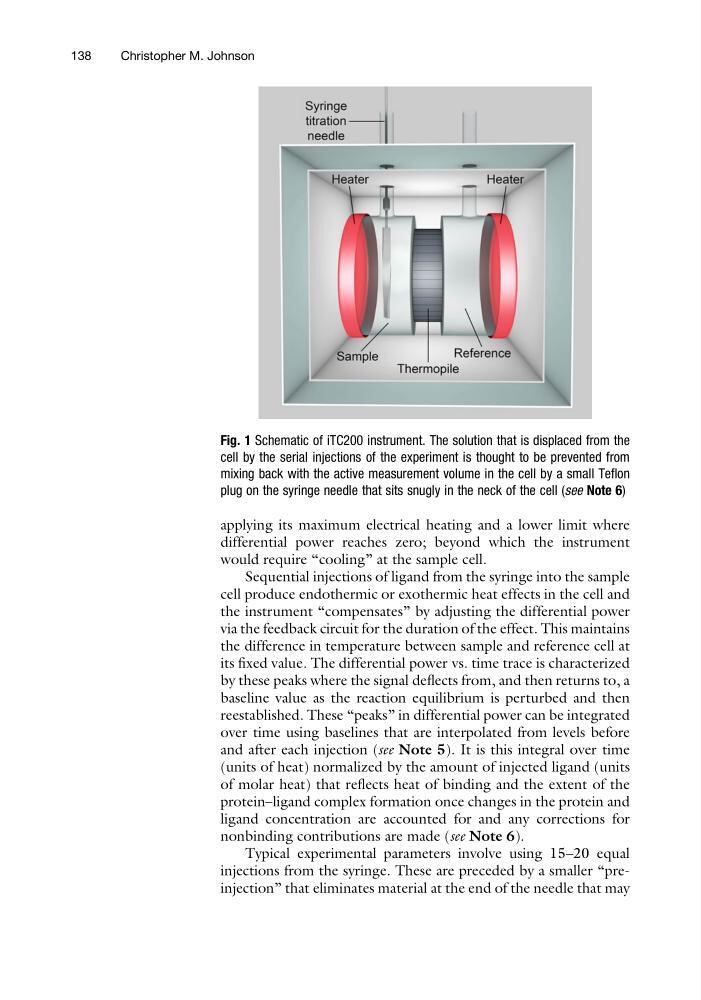
Fig. 1 Schematic of iTC200 instrument. The solution that is displaced from the
cell by the serial injections of the experiment is thought to be prevented from
mixing back with the active measurement volume in the cell by a small Teflon
plug on the syringe needle that sits snugly in the neck of the cell (see Note 6)
138
Christopher M. Johnson
differential power reaches zero; beyond which the instrument
would require “cooling” at the sample cell.
Sequential injections of ligand from the syringe into the sample
cell produce endothermic or exothermic heat effects in the cell and
the instrument “compensates” by adjusting the differential power
via the feedback circuit for the duration of the effect. This maintains
the difference in temperature between sample and reference cell at
its fixed value. The differential power vs. time trace is characterized
by these peaks where the signal deflects from, and then returns to, a
baseline value as the reaction equilibrium is perturbed and then
reestablished. These “peaks” in differential power can be integrated
over time using baselines that are interpolated from levels before
and after each injection (see Note 5). It is this integral over time
(units of heat) normalized by the amount of injected ligand (units
of molar heat) that reflects heat of binding and the extent of the
protein–ligand complex formation once changes in the protein and
ligand concentration are accounted for and any corrections for
nonbinding contributions are made (see Note 6).
Typical experimental parameters involve using 15–20 equal
injections from the syringe. These are preceded by a smaller “preinjection” that eliminates material at the end of the needle that may
Fig. 1 Schematic of iTC200 instrument. The solution that is displaced from the
cell by the serial injections of the experiment is thought to be prevented from
mixing back with the active measurement volume in the cell by a small Teflon
plug on the syringe needle that sits snugly in the neck of the cell (see Note 6)
138
Christopher M. Johnson