

NCBD + ACTR
NCBD:ACTR
[NCBD:ACTR]*
NCBD* + ACTR
NCBD + ACTR
NCBD:ACTR
[NCBD:ACTR]*
NCBD* + ACTR
0
5
10
15
0
100
200
300
0
5
10
15
0
100
200
300
[ACTR} (μM)
k obs (s -1 )
k obs (s -1 )
Time (s)
Fluorescene intensity
Time (s)
4.5 μM
12 μM
0.00
0.05
0.10
0.15
0.20
0.25
6.0
6.5
7.0
7.5
0.00
0.05
0.10
0.15
6.0
6.5
7.0
7.5
0.0
0.1
0.2
-0.1
0.0
0.1
0.0
0.1
-0.1
0.0
0.1
Fluorescence intensity
Time (s)
Time (s)
0.20
0.25
0.2
0.00
0.05
0.10
0.15
0.20
0.25
6.0
6.5
7.0
7.5
0.00
0.05
0.10
0.15
0.20
0.25
6.0
6.5
7.0
7.5
0.0
0.1
0.2
-0.1
0.0
0.1
0.0
0.1
0.2
-0.1
0.0
0.1
Residuals
Residuals
Time (s)
Fluorescene intensity
Time (s)
Fluorescence intensity
Time (s)
Time (s)
Residuals
Residuals
4.5 μM
12 μM
[ACTR} (μM)
k
1
k
-1
k
2
k
-2
k
1
k
-1
k
2
k
-2
k
1
= 16 ± 2 μM
-1
s
-1
k
-1
= 8 ± 16 s
-1
k
2
= 40 ± 74 s
-1
k
-2
= 1 ± 74 s
-1
k
1
= 41 ± 3 s
-1
k
-1
= 8.2 ± 4.5 s
-1
k
2
= 16 ± 2 μM
-1
s
-1
k
-2
= 1 ± 13 s
-1
a
b
k
1
= 15 ± 0.4 μM
-1
s
-1
k
-1
= 14 ± 2 s
-1
k
2
= 31 ± 2 s
-1
k
-2
= 13 ± 0.9 s
-1
k
1
= 44 ± 1 s
-1
k
-1
= 11 ± 2 s
-1
k
2
= 15 ± 0.4 μM
-1
s
-1
k
-2
= 3.1 ± 0.3 s
-1
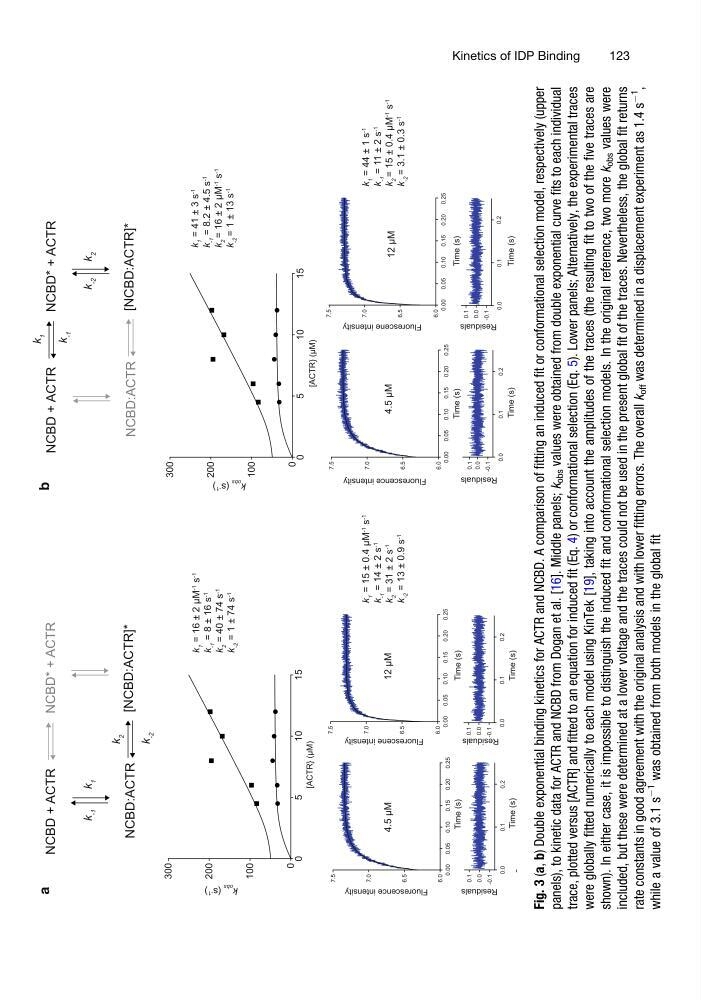
Fig. 3 (a, b) Double exponential binding kinetics for ACTR and NCBD. A comparison of fitting an induced fit or conformational selection model, respectively (upper
panels), to kinetic data for ACTR and NCBD from Dogan et al. [16]. Middle panels; k
obs values were obtained from double exponential curve fits to each individual
trace, plotted versus [ACTR] and fitted to an equation for induced fit (Eq. 4) or conformational selection (Eq. 5). Lower panels; Alternatively, the experimental traces
were globally fitted numerically to each model using KinTek [19], taking into account the amplitudes of the traces (the resulting fit to two of the five traces are
shown). In either case, it is impossible to distinguish the induced fit and conformational selection models. In the original reference, two more k
obs values were
included, but these were determined at a lower voltage and the traces could not be used in the present global fit of the traces. Nevertheless, the global fit returns
rate constants in good agreement with the original analysis and with lower fitting errors. The overall k
off was determined in a displacement experiment as 1.4 s
À1
,
while a value of 3.1 s
À1
was obtained from both models in the global fit
Kinetics of IDP Binding
123
NCBD:ACTR
[NCBD:ACTR]*
NCBD* + ACTR
NCBD + ACTR
NCBD:ACTR
[NCBD:ACTR]*
NCBD* + ACTR
0
5
10
15
0
100
200
300
0
5
10
15
0
100
200
300
[ACTR} (μM)
k obs (s -1 )
k obs (s -1 )
Time (s)
Fluorescene intensity
Time (s)
4.5 μM
12 μM
0.00
0.05
0.10
0.15
0.20
0.25
6.0
6.5
7.0
7.5
0.00
0.05
0.10
0.15
6.0
6.5
7.0
7.5
0.0
0.1
0.2
-0.1
0.0
0.1
0.0
0.1
-0.1
0.0
0.1
Fluorescence intensity
Time (s)
Time (s)
0.20
0.25
0.2
0.00
0.05
0.10
0.15
0.20
0.25
6.0
6.5
7.0
7.5
0.00
0.05
0.10
0.15
0.20
0.25
6.0
6.5
7.0
7.5
0.0
0.1
0.2
-0.1
0.0
0.1
0.0
0.1
0.2
-0.1
0.0
0.1
Residuals
Residuals
Time (s)
Fluorescene intensity
Time (s)
Fluorescence intensity
Time (s)
Time (s)
Residuals
Residuals
4.5 μM
12 μM
[ACTR} (μM)
k
1
k
-1
k
2
k
-2
k
1
k
-1
k
2
k
-2
k
1
= 16 ± 2 μM
-1
s
-1
k
-1
= 8 ± 16 s
-1
k
2
= 40 ± 74 s
-1
k
-2
= 1 ± 74 s
-1
k
1
= 41 ± 3 s
-1
k
-1
= 8.2 ± 4.5 s
-1
k
2
= 16 ± 2 μM
-1
s
-1
k
-2
= 1 ± 13 s
-1
a
b
k
1
= 15 ± 0.4 μM
-1
s
-1
k
-1
= 14 ± 2 s
-1
k
2
= 31 ± 2 s
-1
k
-2
= 13 ± 0.9 s
-1
k
1
= 44 ± 1 s
-1
k
-1
= 11 ± 2 s
-1
k
2
= 15 ± 0.4 μM
-1
s
-1
k
-2
= 3.1 ± 0.3 s
-1
Fig. 3 (a, b) Double exponential binding kinetics for ACTR and NCBD. A comparison of fitting an induced fit or conformational selection model, respectively (upper
panels), to kinetic data for ACTR and NCBD from Dogan et al. [16]. Middle panels; k
obs values were obtained from double exponential curve fits to each individual
trace, plotted versus [ACTR] and fitted to an equation for induced fit (Eq. 4) or conformational selection (Eq. 5). Lower panels; Alternatively, the experimental traces
were globally fitted numerically to each model using KinTek [19], taking into account the amplitudes of the traces (the resulting fit to two of the five traces are
shown). In either case, it is impossible to distinguish the induced fit and conformational selection models. In the original reference, two more k
obs values were
included, but these were determined at a lower voltage and the traces could not be used in the present global fit of the traces. Nevertheless, the global fit returns
rate constants in good agreement with the original analysis and with lower fitting errors. The overall k
off was determined in a displacement experiment as 1.4 s
À1
,
while a value of 3.1 s
À1
was obtained from both models in the global fit
Kinetics of IDP Binding
123