

Time (s)
Time (s)
[p53 TAD peptide] (μM)
k
obs (s
-1
)
Amplitude
Fluorescence intensity
Residuals
[p53 TAD peptide] (μM)
a
b
c
d
0
5
1 0
8.20
8.25
8.30
8.35
8.40
8.45
8.50
0
5
1 0
-0.01
0.00
0.01
Time (s)
Time (s)
Fluorescence intensity
Residuals
0
5
1 0
0.0
0.1
0.2
0.3
k obs ≈ k off = 0.63 s
-1
k on = 8.5 ± 0.3 μM
-1 s
-1
k off = 6 ± 1 s
-1
K D = 0.44 ± 0.08 μM
0.00
0.05
0.10
0.15
0.20
-0.05
0.00
0.05
0.00
0.05
0.10
0.15
0.20
9.6
9.7
9.8
9.9
0
5
1 0
0
20
40
60
80
100
k on = 7.8 ± 0.3 μM
-1 s
-1
k off = 4 ± 2 s
-1
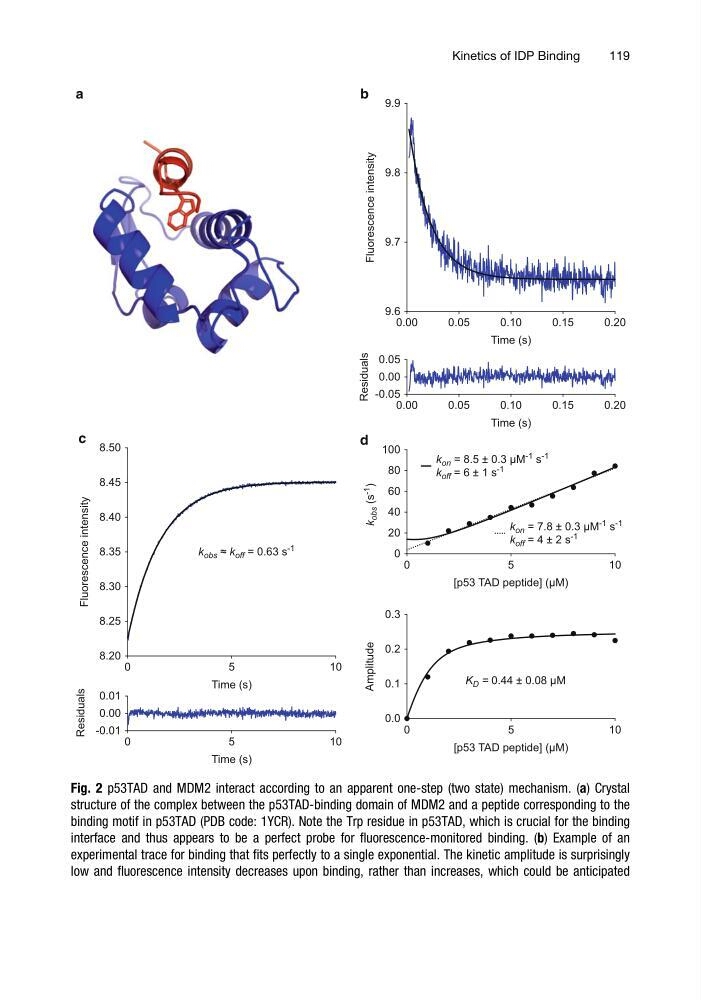
Fig. 2 p53TAD and MDM2 interact according to an apparent one-step (two state) mechanism. (a) Crystal
structure of the complex between the p53TAD-binding domain of MDM2 and a peptide corresponding to the
binding motif in p53TAD (PDB code: 1YCR). Note the Trp residue in p53TAD, which is crucial for the binding
interface and thus appears to be a perfect probe for fluorescence-monitored binding. (b) Example of an
experimental trace for binding that fits perfectly to a single exponential. The kinetic amplitude is surprisingly
low and fluorescence intensity decreases upon binding, rather than increases, which could be anticipated
Kinetics of IDP Binding
119
Time (s)
[p53 TAD peptide] (μM)
k
obs (s
-1
)
Amplitude
Fluorescence intensity
Residuals
[p53 TAD peptide] (μM)
a
b
c
d
0
5
1 0
8.20
8.25
8.30
8.35
8.40
8.45
8.50
0
5
1 0
-0.01
0.00
0.01
Time (s)
Time (s)
Fluorescence intensity
Residuals
0
5
1 0
0.0
0.1
0.2
0.3
k obs ≈ k off = 0.63 s
-1
k on = 8.5 ± 0.3 μM
-1 s
-1
k off = 6 ± 1 s
-1
K D = 0.44 ± 0.08 μM
0.00
0.05
0.10
0.15
0.20
-0.05
0.00
0.05
0.00
0.05
0.10
0.15
0.20
9.6
9.7
9.8
9.9
0
5
1 0
0
20
40
60
80
100
k on = 7.8 ± 0.3 μM
-1 s
-1
k off = 4 ± 2 s
-1
Fig. 2 p53TAD and MDM2 interact according to an apparent one-step (two state) mechanism. (a) Crystal
structure of the complex between the p53TAD-binding domain of MDM2 and a peptide corresponding to the
binding motif in p53TAD (PDB code: 1YCR). Note the Trp residue in p53TAD, which is crucial for the binding
interface and thus appears to be a perfect probe for fluorescence-monitored binding. (b) Example of an
experimental trace for binding that fits perfectly to a single exponential. The kinetic amplitude is surprisingly
low and fluorescence intensity decreases upon binding, rather than increases, which could be anticipated
Kinetics of IDP Binding
119