

firing, tassel sterility and silk receptivity (Zaidi et al. 2016) also considered bestsuited heat tolerance related traits at terminal HS. In wheat, early ground cover, waxy
leaves (Richards 1996), stay green (Kumar et al. 2010) assist in the selection of
tolerance genotype (Govindaraj et al. 2018). In conventional breeding, screening
methods as above validates with the selection indices are very cost-effective and
easy-to-assay technique to find genotypes tolerance to HS. In this regard, researchers
suggested several indices are based either on stress tolerance or susceptibility of
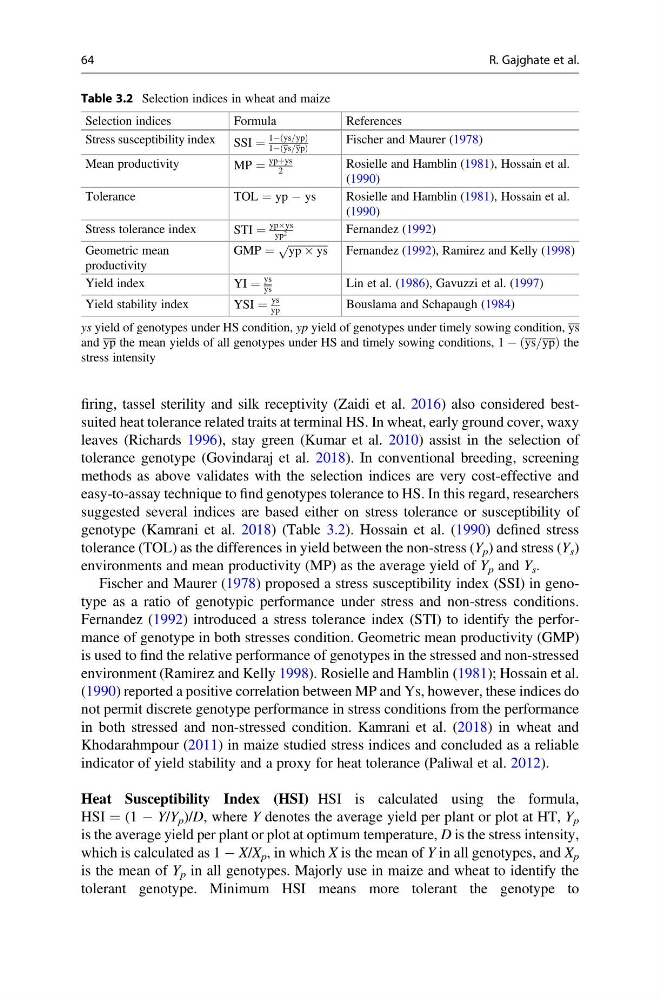
genotype (Kamrani et al. 2018) (Table 3.2). Hossain et al. (1990) defined stress
tolerance (TOL) as the differences in yield between the non-stress (Y p ) and stress (Y s )
environments and mean productivity (MP) as the average yield of Y p and Y s .
Fischer and Maurer (1978) proposed a stress susceptibility index (SSI) in genotype as a ratio of genotypic performance under stress and non-stress conditions.
Fernandez (1992) introduced a stress tolerance index (STI) to identify the performance of genotype in both stresses condition. Geometric mean productivity (GMP)
is used to find the relative performance of genotypes in the stressed and non-stressed
environment (Ramirez and Kelly 1998). Rosielle and Hamblin (1981); Hossain et al.
(1990) reported a positive correlation between MP and Ys, however, these indices do
not permit discrete genotype performance in stress conditions from the performance
in both stressed and non-stressed condition. Kamrani et al. (2018) in wheat and
Khodarahmpour (2011) in maize studied stress indices and concluded as a reliable
indicator of yield stability and a proxy for heat tolerance (Paliwal et al. 2012).
Heat Susceptibility Index (HSI) HSI is calculated using the formula,
HSI ¼ (1 À Y/Y p )/D, where Y denotes the average yield per plant or plot at HT, Y p
is the average yield per plant or plot at optimum temperature, D is the stress intensity,
which is calculated as 1 À X/X p , in which X is the mean of Y in all genotypes, and X p
is the mean of Y p in all genotypes. Majorly use in maize and wheat to identify the
tolerant genotype. Minimum HSI means more tolerant the genotype to
Table 3.2 Selection indices in wheat and maize
Selection indices
Formula
References
Stress susceptibility index SSI ¼
1À ys=yp
ð
Þ
1À ys=yp
ð
Þ
Fischer and Maurer (1978)
Mean productivity
MP ¼
ypþys
2
Rosielle and Hamblin (1981), Hossain et al.
(1990)
Tolerance
TOL ¼ yp À ys
Rosielle and Hamblin (1981), Hossain et al.
(1990)
Stress tolerance index
STI ¼
ypÂys
yp 2
Fernandez (1992)
Geometric mean
productivity
GMP ¼
ffiffiffiffiffiffiffiffiffiffiffiffiffiffiffi
yp  ys
p
Fernandez (1992), Ramirez and Kelly (1998)
Yield index
YI ¼
ys
ys
Lin et al. (1986), Gavuzzi et al. (1997)
Yield stability index
YSI ¼
ys
yp
Bouslama and Schapaugh (1984)
ys yield of genotypes under HS condition, yp yield of genotypes under timely sowing condition, ys
and yp the mean yields of all genotypes under HS and timely sowing conditions, 1 À ys=yp
ð
Þthe
stress intensity
64
R. Gajghate et al.
leaves (Richards 1996), stay green (Kumar et al. 2010) assist in the selection of
tolerance genotype (Govindaraj et al. 2018). In conventional breeding, screening
methods as above validates with the selection indices are very cost-effective and
easy-to-assay technique to find genotypes tolerance to HS. In this regard, researchers
suggested several indices are based either on stress tolerance or susceptibility of
genotype (Kamrani et al. 2018) (Table 3.2). Hossain et al. (1990) defined stress
tolerance (TOL) as the differences in yield between the non-stress (Y p ) and stress (Y s )
environments and mean productivity (MP) as the average yield of Y p and Y s .
Fischer and Maurer (1978) proposed a stress susceptibility index (SSI) in genotype as a ratio of genotypic performance under stress and non-stress conditions.
Fernandez (1992) introduced a stress tolerance index (STI) to identify the performance of genotype in both stresses condition. Geometric mean productivity (GMP)
is used to find the relative performance of genotypes in the stressed and non-stressed
environment (Ramirez and Kelly 1998). Rosielle and Hamblin (1981); Hossain et al.
(1990) reported a positive correlation between MP and Ys, however, these indices do
not permit discrete genotype performance in stress conditions from the performance
in both stressed and non-stressed condition. Kamrani et al. (2018) in wheat and
Khodarahmpour (2011) in maize studied stress indices and concluded as a reliable
indicator of yield stability and a proxy for heat tolerance (Paliwal et al. 2012).
Heat Susceptibility Index (HSI) HSI is calculated using the formula,
HSI ¼ (1 À Y/Y p )/D, where Y denotes the average yield per plant or plot at HT, Y p
is the average yield per plant or plot at optimum temperature, D is the stress intensity,
which is calculated as 1 À X/X p , in which X is the mean of Y in all genotypes, and X p
is the mean of Y p in all genotypes. Majorly use in maize and wheat to identify the
tolerant genotype. Minimum HSI means more tolerant the genotype to
Table 3.2 Selection indices in wheat and maize
Selection indices
Formula
References
Stress susceptibility index SSI ¼
1À ys=yp
ð
Þ
1À ys=yp
ð
Þ
Fischer and Maurer (1978)
Mean productivity
MP ¼
ypþys
2
Rosielle and Hamblin (1981), Hossain et al.
(1990)
Tolerance
TOL ¼ yp À ys
Rosielle and Hamblin (1981), Hossain et al.
(1990)
Stress tolerance index
STI ¼
ypÂys
yp 2
Fernandez (1992)
Geometric mean
productivity
GMP ¼
ffiffiffiffiffiffiffiffiffiffiffiffiffiffiffi
yp  ys
p
Fernandez (1992), Ramirez and Kelly (1998)
Yield index
YI ¼
ys
ys
Lin et al. (1986), Gavuzzi et al. (1997)
Yield stability index
YSI ¼
ys
yp
Bouslama and Schapaugh (1984)
ys yield of genotypes under HS condition, yp yield of genotypes under timely sowing condition, ys
and yp the mean yields of all genotypes under HS and timely sowing conditions, 1 À ys=yp
ð
Þthe
stress intensity
64
R. Gajghate et al.