

5.5
Nutrient Use Efficiency (NUE)
Ratio of intended output and provided nutrient input is called Nutrient Use Efficiency (NUE). Nutrient Use Efficiency can be studied at three different levels but
input and output will vary depending on the level at which NUE is being studied
(Nardoto et al. 2006):
1. Individual plant level: It is the most basic level at which input is quantified in
terms of nutrients supplied, and output in terms of plant yield (both quantitative
and qualitative).
2. Population/crop level: At this level, fertilizers, pesticides as well as labor input are
included, and output is measured in terms of total harvest.
3. Ecosystem level: It is the most complex level as it includes impact of the plant/
crop growth on other species, environment as well as public health. At this level
input is calculated for resources used (both renewable and non-renewable) and
negative impacts on environment, while the intended outcome includes agricultural goods.
Maximum NUE can be achieved by either increasing the output or decreasing the
input. Understanding NUE at individual level is expected to play most important part
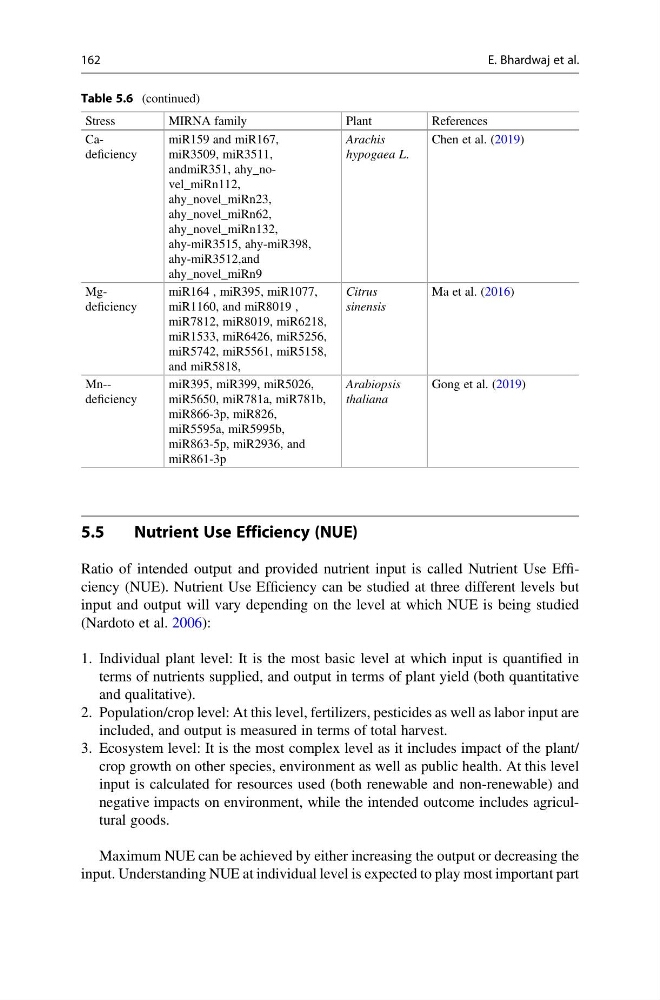
Table 5.6 (continued)
Stress
MIRNA family
Plant
References
Cadeficiency
miR159 and miR167,
miR3509, miR3511,
andmiR351, ahy_novel_miRn112,
ahy_novel_miRn23,
ahy_novel_miRn62,
ahy_novel_miRn132,
ahy-miR3515, ahy-miR398,
ahy-miR3512,and
ahy_novel_miRn9
Arachis
hypogaea L.
Chen et al. (2019)
Mgdeficiency
miR164 , miR395, miR1077,
miR1160, and miR8019 ,
miR7812, miR8019, miR6218,
miR1533, miR6426, miR5256,
miR5742, miR5561, miR5158,
and miR5818,
Citrus
sinensis
Ma et al. (2016)
Mn-deficiency
miR395, miR399, miR5026,
miR5650, miR781a, miR781b,
miR866-3p, miR826,
miR5595a, miR5995b,
miR863-5p, miR2936, and
miR861-3p
Arabiopsis
thaliana
Gong et al. (2019)
162
E. Bhardwaj et al.
Nutrient Use Efficiency (NUE)
Ratio of intended output and provided nutrient input is called Nutrient Use Efficiency (NUE). Nutrient Use Efficiency can be studied at three different levels but
input and output will vary depending on the level at which NUE is being studied
(Nardoto et al. 2006):
1. Individual plant level: It is the most basic level at which input is quantified in
terms of nutrients supplied, and output in terms of plant yield (both quantitative
and qualitative).
2. Population/crop level: At this level, fertilizers, pesticides as well as labor input are
included, and output is measured in terms of total harvest.
3. Ecosystem level: It is the most complex level as it includes impact of the plant/
crop growth on other species, environment as well as public health. At this level
input is calculated for resources used (both renewable and non-renewable) and
negative impacts on environment, while the intended outcome includes agricultural goods.
Maximum NUE can be achieved by either increasing the output or decreasing the
input. Understanding NUE at individual level is expected to play most important part
Table 5.6 (continued)
Stress
MIRNA family
Plant
References
Cadeficiency
miR159 and miR167,
miR3509, miR3511,
andmiR351, ahy_novel_miRn112,
ahy_novel_miRn23,
ahy_novel_miRn62,
ahy_novel_miRn132,
ahy-miR3515, ahy-miR398,
ahy-miR3512,and
ahy_novel_miRn9
Arachis
hypogaea L.
Chen et al. (2019)
Mgdeficiency
miR164 , miR395, miR1077,
miR1160, and miR8019 ,
miR7812, miR8019, miR6218,
miR1533, miR6426, miR5256,
miR5742, miR5561, miR5158,
and miR5818,
Citrus
sinensis
Ma et al. (2016)
Mn-deficiency
miR395, miR399, miR5026,
miR5650, miR781a, miR781b,
miR866-3p, miR826,
miR5595a, miR5995b,
miR863-5p, miR2936, and
miR861-3p
Arabiopsis
thaliana
Gong et al. (2019)
162
E. Bhardwaj et al.