

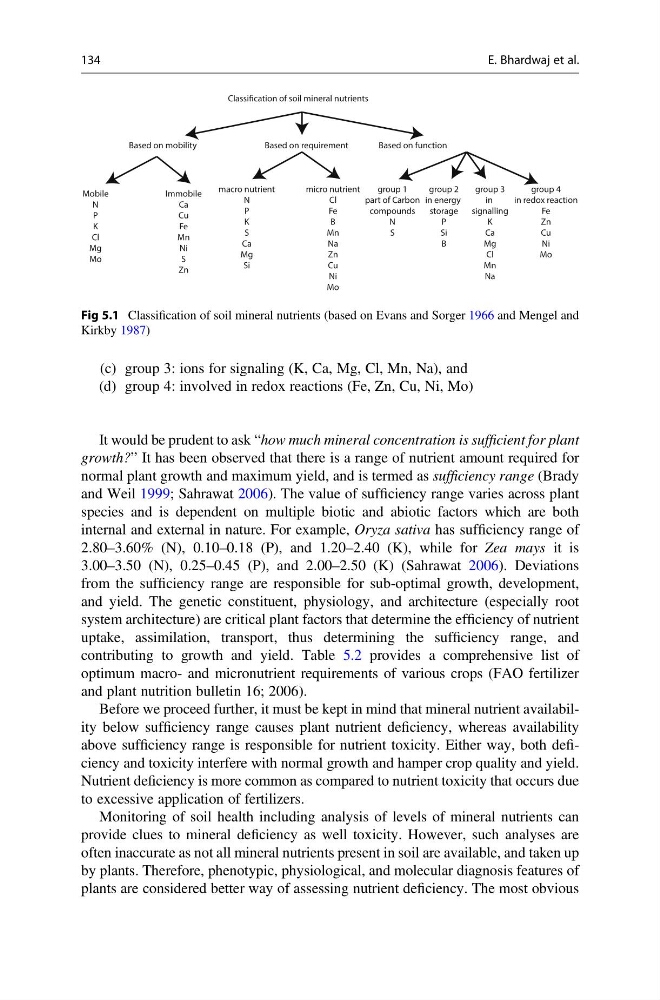
(c) group 3: ions for signaling (K, Ca, Mg, Cl, Mn, Na), and
(d) group 4: involved in redox reactions (Fe, Zn, Cu, Ni, Mo)
It would be prudent to ask “how much mineral concentration is sufficient for plant
growth?” It has been observed that there is a range of nutrient amount required for
normal plant growth and maximum yield, and is termed as sufficiency range (Brady
and Weil 1999; Sahrawat 2006). The value of sufficiency range varies across plant
species and is dependent on multiple biotic and abiotic factors which are both
internal and external in nature. For example, Oryza sativa has sufficiency range of
2.80–3.60% (N), 0.10–0.18 (P), and 1.20–2.40 (K), while for Zea mays it is
3.00–3.50 (N), 0.25–0.45 (P), and 2.00–2.50 (K) (Sahrawat 2006). Deviations
from the sufficiency range are responsible for sub-optimal growth, development,
and yield. The genetic constituent, physiology, and architecture (especially root
system architecture) are critical plant factors that determine the efficiency of nutrient
uptake, assimilation, transport, thus determining the sufficiency range, and
contributing to growth and yield. Table 5.2 provides a comprehensive list of
optimum macro- and micronutrient requirements of various crops (FAO fertilizer
and plant nutrition bulletin 16; 2006).
Before we proceed further, it must be kept in mind that mineral nutrient availability below sufficiency range causes plant nutrient deficiency, whereas availability
above sufficiency range is responsible for nutrient toxicity. Either way, both deficiency and toxicity interfere with normal growth and hamper crop quality and yield.
Nutrient deficiency is more common as compared to nutrient toxicity that occurs due
to excessive application of fertilizers.
Monitoring of soil health including analysis of levels of mineral nutrients can
provide clues to mineral deficiency as well toxicity. However, such analyses are
often inaccurate as not all mineral nutrients present in soil are available, and taken up
by plants. Therefore, phenotypic, physiological, and molecular diagnosis features of
plants are considered better way of assessing nutrient deficiency. The most obvious
Classification of soil mineral nutrients
Based on mobility
Based on requirement
Based on function
Mobile
N
P
K
Cl
Mg
Mo
Immobile
Ca
Cu
Fe
Mn
Ni
S
Zn
macro nutrient
N
P
K
S
Ca
Mg
Si
micro nutrient
Cl
Fe
B
Mn
Na
Zn
Cu
Ni
Mo
group 1
part of Carbon
compounds
N
S
group 2
in energy
storage
P
Si
B
group 3
in
signalling
K
Ca
Mg
Cl
Mn
Na
group 4
in redox reaction
Fe
Zn
Cu
Ni
Mo
Fig 5.1 Classification of soil mineral nutrients (based on Evans and Sorger 1966 and Mengel and
Kirkby 1987)
134
E. Bhardwaj et al.
(d) group 4: involved in redox reactions (Fe, Zn, Cu, Ni, Mo)
It would be prudent to ask “how much mineral concentration is sufficient for plant
growth?” It has been observed that there is a range of nutrient amount required for
normal plant growth and maximum yield, and is termed as sufficiency range (Brady
and Weil 1999; Sahrawat 2006). The value of sufficiency range varies across plant
species and is dependent on multiple biotic and abiotic factors which are both
internal and external in nature. For example, Oryza sativa has sufficiency range of
2.80–3.60% (N), 0.10–0.18 (P), and 1.20–2.40 (K), while for Zea mays it is
3.00–3.50 (N), 0.25–0.45 (P), and 2.00–2.50 (K) (Sahrawat 2006). Deviations
from the sufficiency range are responsible for sub-optimal growth, development,
and yield. The genetic constituent, physiology, and architecture (especially root
system architecture) are critical plant factors that determine the efficiency of nutrient
uptake, assimilation, transport, thus determining the sufficiency range, and
contributing to growth and yield. Table 5.2 provides a comprehensive list of
optimum macro- and micronutrient requirements of various crops (FAO fertilizer
and plant nutrition bulletin 16; 2006).
Before we proceed further, it must be kept in mind that mineral nutrient availability below sufficiency range causes plant nutrient deficiency, whereas availability
above sufficiency range is responsible for nutrient toxicity. Either way, both deficiency and toxicity interfere with normal growth and hamper crop quality and yield.
Nutrient deficiency is more common as compared to nutrient toxicity that occurs due
to excessive application of fertilizers.
Monitoring of soil health including analysis of levels of mineral nutrients can
provide clues to mineral deficiency as well toxicity. However, such analyses are
often inaccurate as not all mineral nutrients present in soil are available, and taken up
by plants. Therefore, phenotypic, physiological, and molecular diagnosis features of
plants are considered better way of assessing nutrient deficiency. The most obvious
Classification of soil mineral nutrients
Based on mobility
Based on requirement
Based on function
Mobile
N
P
K
Cl
Mg
Mo
Immobile
Ca
Cu
Fe
Mn
Ni
S
Zn
macro nutrient
N
P
K
S
Ca
Mg
Si
micro nutrient
Cl
Fe
B
Mn
Na
Zn
Cu
Ni
Mo
group 1
part of Carbon
compounds
N
S
group 2
in energy
storage
P
Si
B
group 3
in
signalling
K
Ca
Mg
Cl
Mn
Na
group 4
in redox reaction
Fe
Zn
Cu
Ni
Mo
Fig 5.1 Classification of soil mineral nutrients (based on Evans and Sorger 1966 and Mengel and
Kirkby 1987)
134
E. Bhardwaj et al.