

visualization.” Semi-supervised learning, on the other hand, is between supervised
and unsupervised learning which is “a learning paradigm concerned with the study
of how computers and natural systems such as humans learn in the presence of both
labelled and unlabeled data” (Zhu and Goldberg 2009).
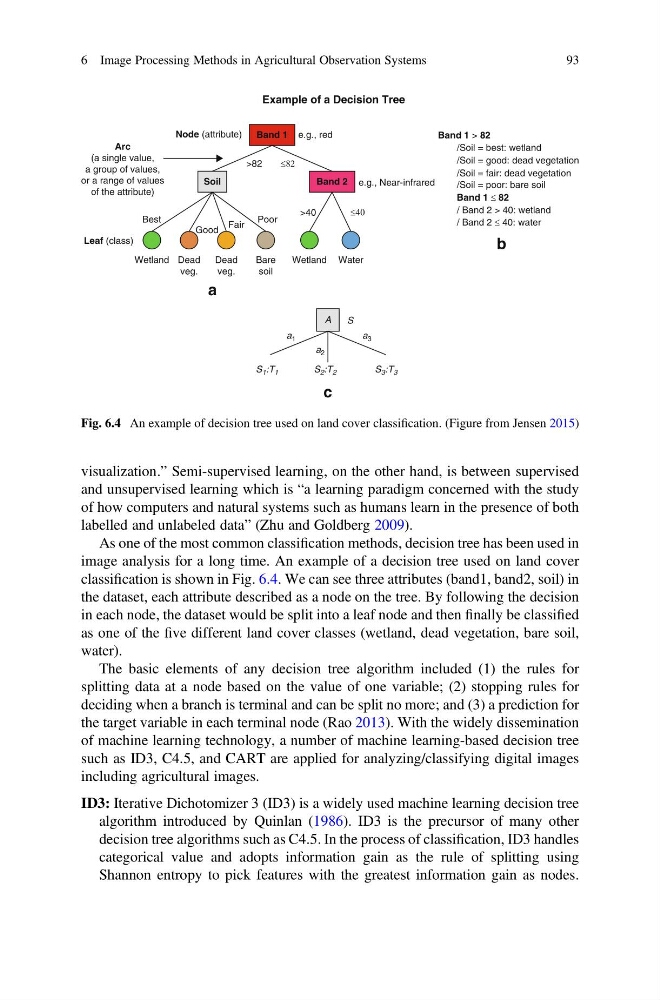
As one of the most common classification methods, decision tree has been used in
image analysis for a long time. An example of a decision tree used on land cover
classification is shown in Fig. 6.4. We can see three attributes (band1, band2, soil) in
the dataset, each attribute described as a node on the tree. By following the decision
in each node, the dataset would be split into a leaf node and then finally be classified
as one of the five different land cover classes (wetland, dead vegetation, bare soil,
water).
The basic elements of any decision tree algorithm included (1) the rules for
splitting data at a node based on the value of one variable; (2) stopping rules for
deciding when a branch is terminal and can be split no more; and (3) a prediction for
the target variable in each terminal node (Rao 2013). With the widely dissemination
of machine learning technology, a number of machine learning-based decision tree
such as ID3, C4.5, and CART are applied for analyzing/classifying digital images
including agricultural images.
ID3: Iterative Dichotomizer 3 (ID3) is a widely used machine learning decision tree
algorithm introduced by Quinlan (1986). ID3 is the precursor of many other
decision tree algorithms such as C4.5. In the process of classification, ID3 handles
categorical value and adopts information gain as the rule of splitting using
Shannon entropy to pick features with the greatest information gain as nodes.
Arc
(a single value,
a group of values,
or a range of values
of the attribute)
Node (attribute)
e.g., red
>82
>40
≤82
≤40
Band 2
Leaf (class)
Best
Wetland Dead
veg.
a
Dead
veg.
Bare
soil
c
A
a 1
a 3
a 2
S
S 1 :T 1
S 2 :T 2
S 3 :T 3
Wetland Water
Good
Fair
Poor
Soil
Band 1
Example of a Decision Tree
Band 1 > 82
Band 1 ≤ 82
/Soil = best: wetland
/Soil = good: dead vegetation
/Soil = fair: dead vegetation
/Soil = poor: bare soil
/ Band 2 > 40: wetland
/ Band 2 ≤ 40: water
b
e.g., Near-infrared
Fig. 6.4 An example of decision tree used on land cover classification. (Figure from Jensen 2015)
6 Image Processing Methods in Agricultural Observation Systems
93
and unsupervised learning which is “a learning paradigm concerned with the study
of how computers and natural systems such as humans learn in the presence of both
labelled and unlabeled data” (Zhu and Goldberg 2009).
As one of the most common classification methods, decision tree has been used in
image analysis for a long time. An example of a decision tree used on land cover
classification is shown in Fig. 6.4. We can see three attributes (band1, band2, soil) in
the dataset, each attribute described as a node on the tree. By following the decision
in each node, the dataset would be split into a leaf node and then finally be classified
as one of the five different land cover classes (wetland, dead vegetation, bare soil,
water).
The basic elements of any decision tree algorithm included (1) the rules for
splitting data at a node based on the value of one variable; (2) stopping rules for
deciding when a branch is terminal and can be split no more; and (3) a prediction for
the target variable in each terminal node (Rao 2013). With the widely dissemination
of machine learning technology, a number of machine learning-based decision tree
such as ID3, C4.5, and CART are applied for analyzing/classifying digital images
including agricultural images.
ID3: Iterative Dichotomizer 3 (ID3) is a widely used machine learning decision tree
algorithm introduced by Quinlan (1986). ID3 is the precursor of many other
decision tree algorithms such as C4.5. In the process of classification, ID3 handles
categorical value and adopts information gain as the rule of splitting using
Shannon entropy to pick features with the greatest information gain as nodes.
Arc
(a single value,
a group of values,
or a range of values
of the attribute)
Node (attribute)
e.g., red
>82
>40
≤82
≤40
Band 2
Leaf (class)
Best
Wetland Dead
veg.
a
Dead
veg.
Bare
soil
c
A
a 1
a 3
a 2
S
S 1 :T 1
S 2 :T 2
S 3 :T 3
Wetland Water
Good
Fair
Poor
Soil
Band 1
Example of a Decision Tree
Band 1 > 82
Band 1 ≤ 82
/Soil = best: wetland
/Soil = good: dead vegetation
/Soil = fair: dead vegetation
/Soil = poor: bare soil
/ Band 2 > 40: wetland
/ Band 2 ≤ 40: water
b
e.g., Near-infrared
Fig. 6.4 An example of decision tree used on land cover classification. (Figure from Jensen 2015)
6 Image Processing Methods in Agricultural Observation Systems
93