

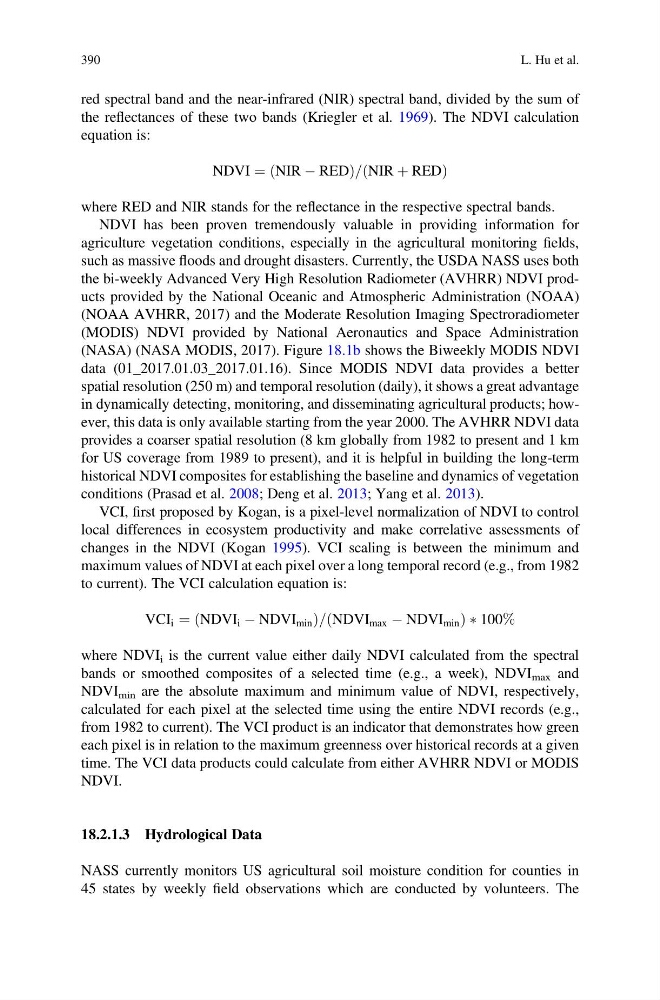
red spectral band and the near-infrared (NIR) spectral band, divided by the sum of
the reflectances of these two bands (Kriegler et al. 1969). The NDVI calculation
equation is:
NDVI ¼ NIR À RED
ð
Þ = NIR þ RED
ð
Þ
where RED and NIR stands for the reflectance in the respective spectral bands.
NDVI has been proven tremendously valuable in providing information for
agriculture vegetation conditions, especially in the agricultural monitoring fields,
such as massive floods and drought disasters. Currently, the USDA NASS uses both
the bi-weekly Advanced Very High Resolution Radiometer (AVHRR) NDVI products provided by the National Oceanic and Atmospheric Administration (NOAA)
(NOAA AVHRR, 2017) and the Moderate Resolution Imaging Spectroradiometer
(MODIS) NDVI provided by National Aeronautics and Space Administration
(NASA) (NASA MODIS, 2017). Figure 18.1b shows the Biweekly MODIS NDVI
data (01_2017.01.03_2017.01.16). Since MODIS NDVI data provides a better
spatial resolution (250 m) and temporal resolution (daily), it shows a great advantage
in dynamically detecting, monitoring, and disseminating agricultural products; however, this data is only available starting from the year 2000. The AVHRR NDVI data
provides a coarser spatial resolution (8 km globally from 1982 to present and 1 km
for US coverage from 1989 to present), and it is helpful in building the long-term
historical NDVI composites for establishing the baseline and dynamics of vegetation
conditions (Prasad et al. 2008; Deng et al. 2013; Yang et al. 2013).
VCI, first proposed by Kogan, is a pixel-level normalization of NDVI to control
local differences in ecosystem productivity and make correlative assessments of
changes in the NDVI (Kogan 1995). VCI scaling is between the minimum and
maximum values of NDVI at each pixel over a long temporal record (e.g., from 1982
to current). The VCI calculation equation is:
VCI i ¼ NDVI i À NDVI min
ð
Þ = NDVI max À NDVI min
ð
Þ Ã 100%
where NDVI i is the current value either daily NDVI calculated from the spectral
bands or smoothed composites of a selected time (e.g., a week), NDVI max and
NDVI min are the absolute maximum and minimum value of NDVI, respectively,
calculated for each pixel at the selected time using the entire NDVI records (e.g.,
from 1982 to current). The VCI product is an indicator that demonstrates how green
each pixel is in relation to the maximum greenness over historical records at a given
time. The VCI data products could calculate from either AVHRR NDVI or MODIS
NDVI.
18.2.1.3 Hydrological Data
NASS currently monitors US agricultural soil moisture condition for counties in
45 states by weekly field observations which are conducted by volunteers. The
390
L. Hu et al.
the reflectances of these two bands (Kriegler et al. 1969). The NDVI calculation
equation is:
NDVI ¼ NIR À RED
ð
Þ = NIR þ RED
ð
Þ
where RED and NIR stands for the reflectance in the respective spectral bands.
NDVI has been proven tremendously valuable in providing information for
agriculture vegetation conditions, especially in the agricultural monitoring fields,
such as massive floods and drought disasters. Currently, the USDA NASS uses both
the bi-weekly Advanced Very High Resolution Radiometer (AVHRR) NDVI products provided by the National Oceanic and Atmospheric Administration (NOAA)
(NOAA AVHRR, 2017) and the Moderate Resolution Imaging Spectroradiometer
(MODIS) NDVI provided by National Aeronautics and Space Administration
(NASA) (NASA MODIS, 2017). Figure 18.1b shows the Biweekly MODIS NDVI
data (01_2017.01.03_2017.01.16). Since MODIS NDVI data provides a better
spatial resolution (250 m) and temporal resolution (daily), it shows a great advantage
in dynamically detecting, monitoring, and disseminating agricultural products; however, this data is only available starting from the year 2000. The AVHRR NDVI data
provides a coarser spatial resolution (8 km globally from 1982 to present and 1 km
for US coverage from 1989 to present), and it is helpful in building the long-term
historical NDVI composites for establishing the baseline and dynamics of vegetation
conditions (Prasad et al. 2008; Deng et al. 2013; Yang et al. 2013).
VCI, first proposed by Kogan, is a pixel-level normalization of NDVI to control
local differences in ecosystem productivity and make correlative assessments of
changes in the NDVI (Kogan 1995). VCI scaling is between the minimum and
maximum values of NDVI at each pixel over a long temporal record (e.g., from 1982
to current). The VCI calculation equation is:
VCI i ¼ NDVI i À NDVI min
ð
Þ = NDVI max À NDVI min
ð
Þ Ã 100%
where NDVI i is the current value either daily NDVI calculated from the spectral
bands or smoothed composites of a selected time (e.g., a week), NDVI max and
NDVI min are the absolute maximum and minimum value of NDVI, respectively,
calculated for each pixel at the selected time using the entire NDVI records (e.g.,
from 1982 to current). The VCI product is an indicator that demonstrates how green
each pixel is in relation to the maximum greenness over historical records at a given
time. The VCI data products could calculate from either AVHRR NDVI or MODIS
NDVI.
18.2.1.3 Hydrological Data
NASS currently monitors US agricultural soil moisture condition for counties in
45 states by weekly field observations which are conducted by volunteers. The
390
L. Hu et al.