

than 0.65. Therefore, we can conclude that the threshold model is an effective
method for mapping PML with MODIS time-series data.
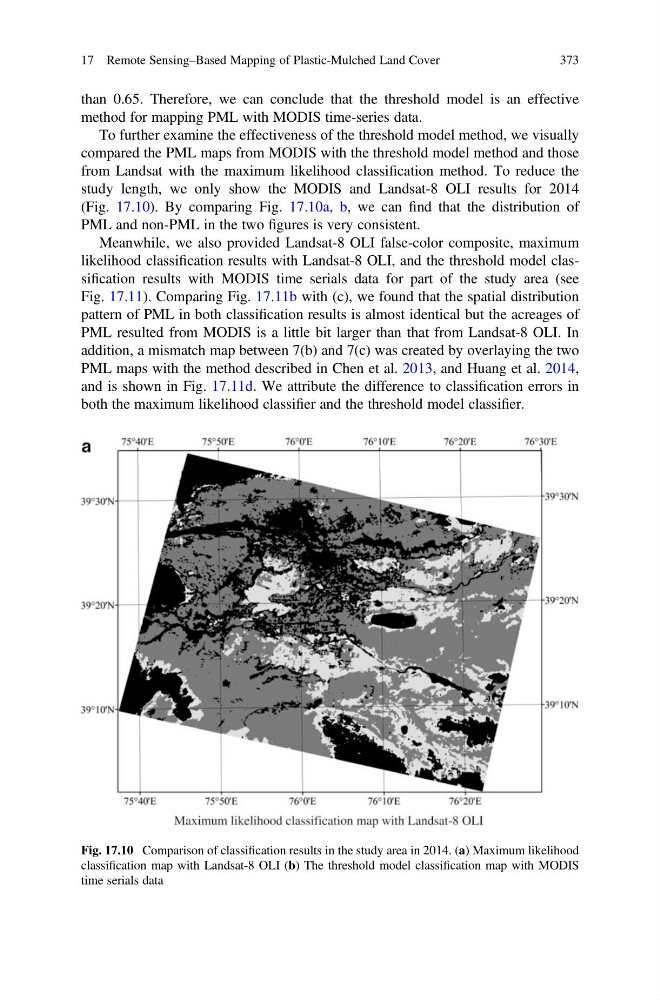
To further examine the effectiveness of the threshold model method, we visually
compared the PML maps from MODIS with the threshold model method and those
from Landsat with the maximum likelihood classification method. To reduce the
study length, we only show the MODIS and Landsat-8 OLI results for 2014
(Fig. 17.10). By comparing Fig. 17.10a, b, we can find that the distribution of
PML and non-PML in the two figures is very consistent.
Meanwhile, we also provided Landsat-8 OLI false-color composite, maximum
likelihood classification results with Landsat-8 OLI, and the threshold model classification results with MODIS time serials data for part of the study area (see
Fig. 17.11). Comparing Fig. 17.11b with (c), we found that the spatial distribution
pattern of PML in both classification results is almost identical but the acreages of
PML resulted from MODIS is a little bit larger than that from Landsat-8 OLI. In
addition, a mismatch map between 7(b) and 7(c) was created by overlaying the two
PML maps with the method described in Chen et al. 2013, and Huang et al. 2014,
and is shown in Fig. 17.11d. We attribute the difference to classification errors in
both the maximum likelihood classifier and the threshold model classifier.
Fig. 17.10 Comparison of classification results in the study area in 2014. (a) Maximum likelihood
classification map with Landsat-8 OLI (b) The threshold model classification map with MODIS
time serials data
17 Remote Sensing–Based Mapping of Plastic-Mulched Land Cover
373
method for mapping PML with MODIS time-series data.
To further examine the effectiveness of the threshold model method, we visually
compared the PML maps from MODIS with the threshold model method and those
from Landsat with the maximum likelihood classification method. To reduce the
study length, we only show the MODIS and Landsat-8 OLI results for 2014
(Fig. 17.10). By comparing Fig. 17.10a, b, we can find that the distribution of
PML and non-PML in the two figures is very consistent.
Meanwhile, we also provided Landsat-8 OLI false-color composite, maximum
likelihood classification results with Landsat-8 OLI, and the threshold model classification results with MODIS time serials data for part of the study area (see
Fig. 17.11). Comparing Fig. 17.11b with (c), we found that the spatial distribution
pattern of PML in both classification results is almost identical but the acreages of
PML resulted from MODIS is a little bit larger than that from Landsat-8 OLI. In
addition, a mismatch map between 7(b) and 7(c) was created by overlaying the two
PML maps with the method described in Chen et al. 2013, and Huang et al. 2014,
and is shown in Fig. 17.11d. We attribute the difference to classification errors in
both the maximum likelihood classifier and the threshold model classifier.
Fig. 17.10 Comparison of classification results in the study area in 2014. (a) Maximum likelihood
classification map with Landsat-8 OLI (b) The threshold model classification map with MODIS
time serials data
17 Remote Sensing–Based Mapping of Plastic-Mulched Land Cover
373