

1997), the decision-tree classifiers have been successfully used for extraction of
land-cover information from remote sensing data (Xu et al. 2005). For instance,
Hansen et al. (1996) compared the performance of a decision-tree classifier with that
of a maximum likelihood classifier by using a 1
by 1
global data set and found the
classification accuracy was comparable. Simard et al. (2000) constructed a decision
tree without assuming a particular probability density distribution of the input data
and applied the tree to classify SAR images. The results showed that the tree is
adaptive for land-cover classification.
As shown in Tables 17.1 and Fig. 17.3, there are significant differences in the
visual interpretation features and the spectral curves between PML1 and PML2 and
between Bare Land1 and Bare Land2 due to the difference in underlying soils.
However, this study does not care much about the types of the underlying surface.
Therefore, PML1 and PML2 are merged into one PML class and Bare Land1 and
Bare Land2 into Bare Land class. Therefore, there are six land-cover types in this
study.
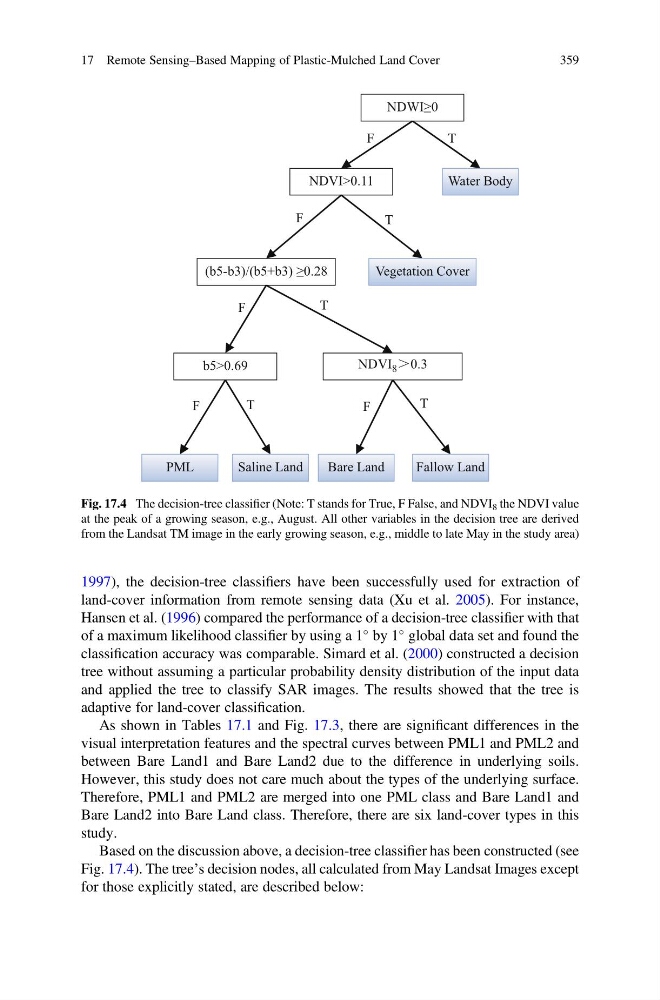
Based on the discussion above, a decision-tree classifier has been constructed (see
Fig. 17.4). The tree’s decision nodes, all calculated from May Landsat Images except
for those explicitly stated, are described below:
NDWI≥0
NDVI>0.11
T
F
F
T
F
Water Body
Vegetation Cover
T
F
T
PML
(b5-b3)/(b5+b3) ≥0.28
b5>0.69
Saline Land
NDVI 8 ˚0.3
T
F
Bare Land
Fallow Land
Fig. 17.4 The decision-tree classifier (Note: T stands for True, F False, and NDVI 8 the NDVI value
at the peak of a growing season, e.g., August. All other variables in the decision tree are derived
from the Landsat TM image in the early growing season, e.g., middle to late May in the study area)
17 Remote Sensing–Based Mapping of Plastic-Mulched Land Cover
359
land-cover information from remote sensing data (Xu et al. 2005). For instance,
Hansen et al. (1996) compared the performance of a decision-tree classifier with that
of a maximum likelihood classifier by using a 1
by 1
global data set and found the
classification accuracy was comparable. Simard et al. (2000) constructed a decision
tree without assuming a particular probability density distribution of the input data
and applied the tree to classify SAR images. The results showed that the tree is
adaptive for land-cover classification.
As shown in Tables 17.1 and Fig. 17.3, there are significant differences in the
visual interpretation features and the spectral curves between PML1 and PML2 and
between Bare Land1 and Bare Land2 due to the difference in underlying soils.
However, this study does not care much about the types of the underlying surface.
Therefore, PML1 and PML2 are merged into one PML class and Bare Land1 and
Bare Land2 into Bare Land class. Therefore, there are six land-cover types in this
study.
Based on the discussion above, a decision-tree classifier has been constructed (see
Fig. 17.4). The tree’s decision nodes, all calculated from May Landsat Images except
for those explicitly stated, are described below:
NDWI≥0
NDVI>0.11
T
F
F
T
F
Water Body
Vegetation Cover
T
F
T
PML
(b5-b3)/(b5+b3) ≥0.28
b5>0.69
Saline Land
NDVI 8 ˚0.3
T
F
Bare Land
Fallow Land
Fig. 17.4 The decision-tree classifier (Note: T stands for True, F False, and NDVI 8 the NDVI value
at the peak of a growing season, e.g., August. All other variables in the decision tree are derived
from the Landsat TM image in the early growing season, e.g., middle to late May in the study area)
17 Remote Sensing–Based Mapping of Plastic-Mulched Land Cover
359