

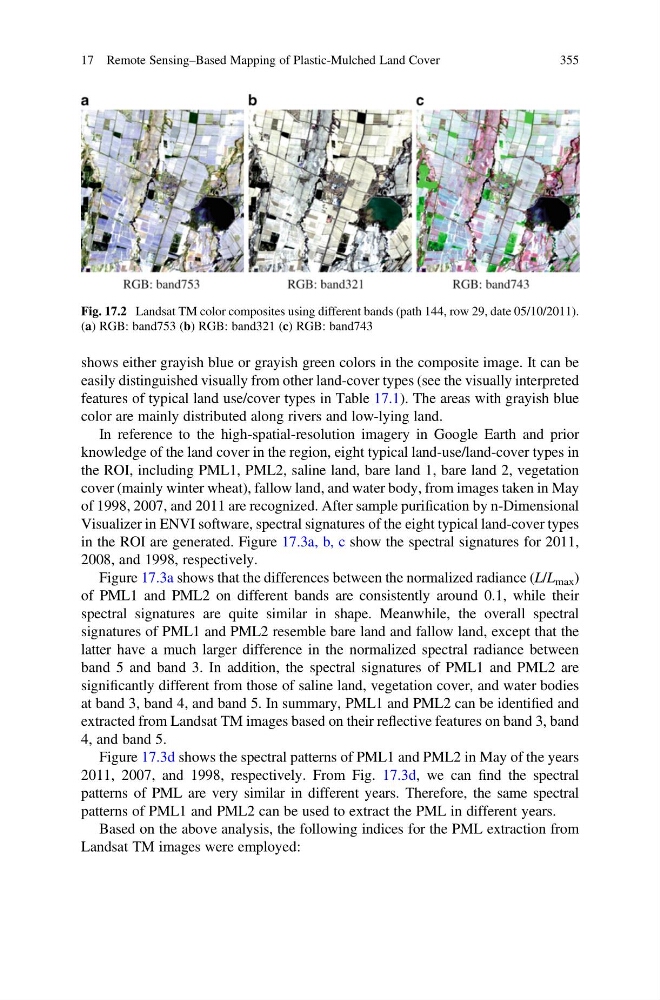
shows either grayish blue or grayish green colors in the composite image. It can be
easily distinguished visually from other land-cover types (see the visually interpreted
features of typical land use/cover types in Table 17.1). The areas with grayish blue
color are mainly distributed along rivers and low-lying land.
In reference to the high-spatial-resolution imagery in Google Earth and prior
knowledge of the land cover in the region, eight typical land-use/land-cover types in
the ROI, including PML1, PML2, saline land, bare land 1, bare land 2, vegetation
cover (mainly winter wheat), fallow land, and water body, from images taken in May
of 1998, 2007, and 2011 are recognized. After sample purification by n-Dimensional
Visualizer in ENVI software, spectral signatures of the eight typical land-cover types
in the ROI are generated. Figure 17.3a, b, c show the spectral signatures for 2011,
2008, and 1998, respectively.
Figure 17.3a shows that the differences between the normalized radiance (L/L max )
of PML1 and PML2 on different bands are consistently around 0.1, while their
spectral signatures are quite similar in shape. Meanwhile, the overall spectral
signatures of PML1 and PML2 resemble bare land and fallow land, except that the
latter have a much larger difference in the normalized spectral radiance between
band 5 and band 3. In addition, the spectral signatures of PML1 and PML2 are
significantly different from those of saline land, vegetation cover, and water bodies
at band 3, band 4, and band 5. In summary, PML1 and PML2 can be identified and
extracted from Landsat TM images based on their reflective features on band 3, band
4, and band 5.
Figure 17.3d shows the spectral patterns of PML1 and PML2 in May of the years
2011, 2007, and 1998, respectively. From Fig. 17.3d, we can find the spectral
patterns of PML are very similar in different years. Therefore, the same spectral
patterns of PML1 and PML2 can be used to extract the PML in different years.
Based on the above analysis, the following indices for the PML extraction from
Landsat TM images were employed:
Fig. 17.2 Landsat TM color composites using different bands (path 144, row 29, date 05/10/2011).
(a) RGB: band753 (b) RGB: band321 (c) RGB: band743
17 Remote Sensing–Based Mapping of Plastic-Mulched Land Cover
355
easily distinguished visually from other land-cover types (see the visually interpreted
features of typical land use/cover types in Table 17.1). The areas with grayish blue
color are mainly distributed along rivers and low-lying land.
In reference to the high-spatial-resolution imagery in Google Earth and prior
knowledge of the land cover in the region, eight typical land-use/land-cover types in
the ROI, including PML1, PML2, saline land, bare land 1, bare land 2, vegetation
cover (mainly winter wheat), fallow land, and water body, from images taken in May
of 1998, 2007, and 2011 are recognized. After sample purification by n-Dimensional
Visualizer in ENVI software, spectral signatures of the eight typical land-cover types
in the ROI are generated. Figure 17.3a, b, c show the spectral signatures for 2011,
2008, and 1998, respectively.
Figure 17.3a shows that the differences between the normalized radiance (L/L max )
of PML1 and PML2 on different bands are consistently around 0.1, while their
spectral signatures are quite similar in shape. Meanwhile, the overall spectral
signatures of PML1 and PML2 resemble bare land and fallow land, except that the
latter have a much larger difference in the normalized spectral radiance between
band 5 and band 3. In addition, the spectral signatures of PML1 and PML2 are
significantly different from those of saline land, vegetation cover, and water bodies
at band 3, band 4, and band 5. In summary, PML1 and PML2 can be identified and
extracted from Landsat TM images based on their reflective features on band 3, band
4, and band 5.
Figure 17.3d shows the spectral patterns of PML1 and PML2 in May of the years
2011, 2007, and 1998, respectively. From Fig. 17.3d, we can find the spectral
patterns of PML are very similar in different years. Therefore, the same spectral
patterns of PML1 and PML2 can be used to extract the PML in different years.
Based on the above analysis, the following indices for the PML extraction from
Landsat TM images were employed:
Fig. 17.2 Landsat TM color composites using different bands (path 144, row 29, date 05/10/2011).
(a) RGB: band753 (b) RGB: band321 (c) RGB: band743
17 Remote Sensing–Based Mapping of Plastic-Mulched Land Cover
355