

15.4.2 Vegetation Condition Index (VCI)
Single NDVI imagery is not sufficient to assess the impact of weather on plants.
Instead, it can aid in separating vegetative features such as grassland, shrubs,
cropland, and forests from non-vegetative such as roads, buildings, lakes, and rivers
across the imagery. For this reason, Kogan (1995) developed Vegetation Condition
Index (VCI) to emphasize changes in NDVI due to weather conditions (i.e., temperature and precipitation) by eliminating long-term signals in NDVI due to vegetation type and climate. VCI can be calculated by the following formula:
VCI ij ¼ NDVI ij ¼ NDVI min
À
Á = NDVI max À NDVI min
ð
Þ
ð 15:10Þ
where NDVI min and NDVI max are minimum and maximum NDVIs considering all
the historical NDVI values for a pixel, respectively. NDVI ij and VCI ij are NDVI and
VCI values of the ith Julian day of j year (e.g., 225th day of 2012 ¼ August
12, 2012) for the same pixel. Over the years, VCI has been extensively utilized
and tested to monitor droughts worldwide, and its drought reports have been
successfully validated against crop yields and conventional drought indices based
on ground-measured precipitation and temperature records collected at the meteorological stations (Kogan 1997; Yagci et al. 2011, 2012; Deng et al. 2013; Yagci
et al. 2013; 2016).
To distinguish drought-affected areas, the VCI maps are classified by the drought
classification scheme adapted from the United States Drought Monitor (USDM)
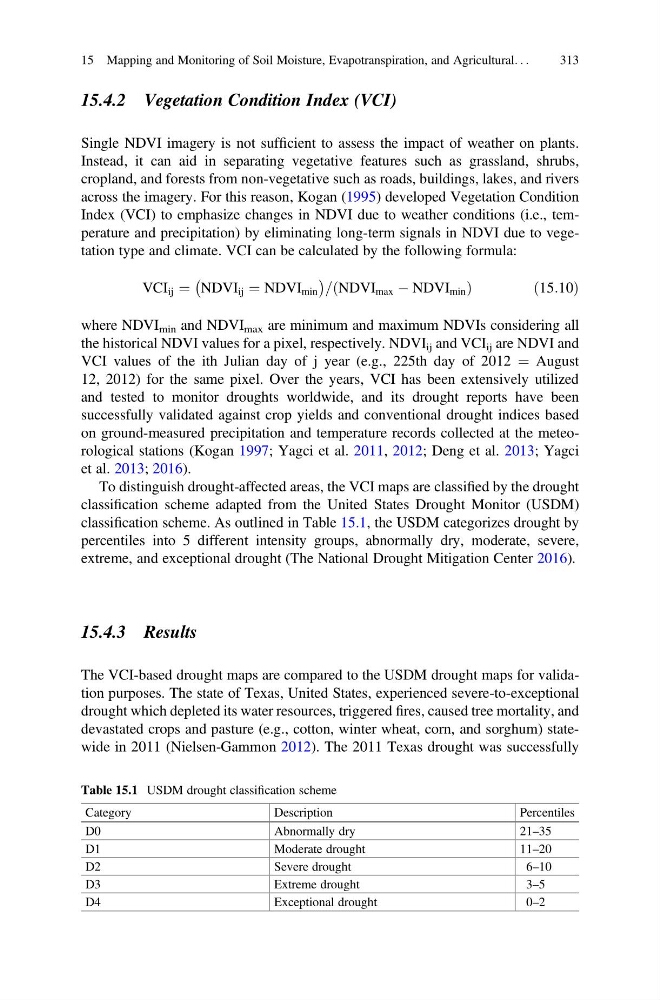
classification scheme. As outlined in Table 15.1, the USDM categorizes drought by
percentiles into 5 different intensity groups, abnormally dry, moderate, severe,
extreme, and exceptional drought (The National Drought Mitigation Center 2016).
15.4.3 Results
The VCI-based drought maps are compared to the USDM drought maps for validation purposes. The state of Texas, United States, experienced severe-to-exceptional
drought which depleted its water resources, triggered fires, caused tree mortality, and
devastated crops and pasture (e.g., cotton, winter wheat, corn, and sorghum) statewide in 2011 (Nielsen-Gammon 2012). The 2011 Texas drought was successfully
Table 15.1 USDM drought classification scheme
Category
Description
Percentiles
D0
Abnormally dry
21–35
D1
Moderate drought
11–20
D2
Severe drought
6–10
D3
Extreme drought
3–5
D4
Exceptional drought
0–2
15 Mapping and Monitoring of Soil Moisture, Evapotranspiration, and Agricultural. . .
313
Single NDVI imagery is not sufficient to assess the impact of weather on plants.
Instead, it can aid in separating vegetative features such as grassland, shrubs,
cropland, and forests from non-vegetative such as roads, buildings, lakes, and rivers
across the imagery. For this reason, Kogan (1995) developed Vegetation Condition
Index (VCI) to emphasize changes in NDVI due to weather conditions (i.e., temperature and precipitation) by eliminating long-term signals in NDVI due to vegetation type and climate. VCI can be calculated by the following formula:
VCI ij ¼ NDVI ij ¼ NDVI min
À
Á = NDVI max À NDVI min
ð
Þ
ð 15:10Þ
where NDVI min and NDVI max are minimum and maximum NDVIs considering all
the historical NDVI values for a pixel, respectively. NDVI ij and VCI ij are NDVI and
VCI values of the ith Julian day of j year (e.g., 225th day of 2012 ¼ August
12, 2012) for the same pixel. Over the years, VCI has been extensively utilized
and tested to monitor droughts worldwide, and its drought reports have been
successfully validated against crop yields and conventional drought indices based
on ground-measured precipitation and temperature records collected at the meteorological stations (Kogan 1997; Yagci et al. 2011, 2012; Deng et al. 2013; Yagci
et al. 2013; 2016).
To distinguish drought-affected areas, the VCI maps are classified by the drought
classification scheme adapted from the United States Drought Monitor (USDM)
classification scheme. As outlined in Table 15.1, the USDM categorizes drought by
percentiles into 5 different intensity groups, abnormally dry, moderate, severe,
extreme, and exceptional drought (The National Drought Mitigation Center 2016).
15.4.3 Results
The VCI-based drought maps are compared to the USDM drought maps for validation purposes. The state of Texas, United States, experienced severe-to-exceptional
drought which depleted its water resources, triggered fires, caused tree mortality, and
devastated crops and pasture (e.g., cotton, winter wheat, corn, and sorghum) statewide in 2011 (Nielsen-Gammon 2012). The 2011 Texas drought was successfully
Table 15.1 USDM drought classification scheme
Category
Description
Percentiles
D0
Abnormally dry
21–35
D1
Moderate drought
11–20
D2
Severe drought
6–10
D3
Extreme drought
3–5
D4
Exceptional drought
0–2
15 Mapping and Monitoring of Soil Moisture, Evapotranspiration, and Agricultural. . .
313