

data and satellite VI to the yields simulated from a crop growth model. Recently,
large area mapping using SCYM and Landsat has been enabled using the Google
Earth Engine (GEE) technology (Gorelick et al. 2017).
In contrast with physiology-based crop growth models, the process-based
approach uses the light use efficiency model to estimate crop yield. This approach
uses four primary inputs: incoming photosynthetically active radiation (PAR), the
fraction of PAR (fAPAR), the light-use efficiency (LUE), and the harvest index (HI).
The absorbed PAR (APAR) is the product of PAR and fAPAR. PAR can be
measured from ground meteorological stations or computed from satellite observations. Since fAPAR is related to VI, crop biomass and yield could be determined by
VI using a process-based yield estimation model. Gao et al. (2018) examined the add
values of VI from multiple remote sensing sources (Landsat, Sentinel-2, and
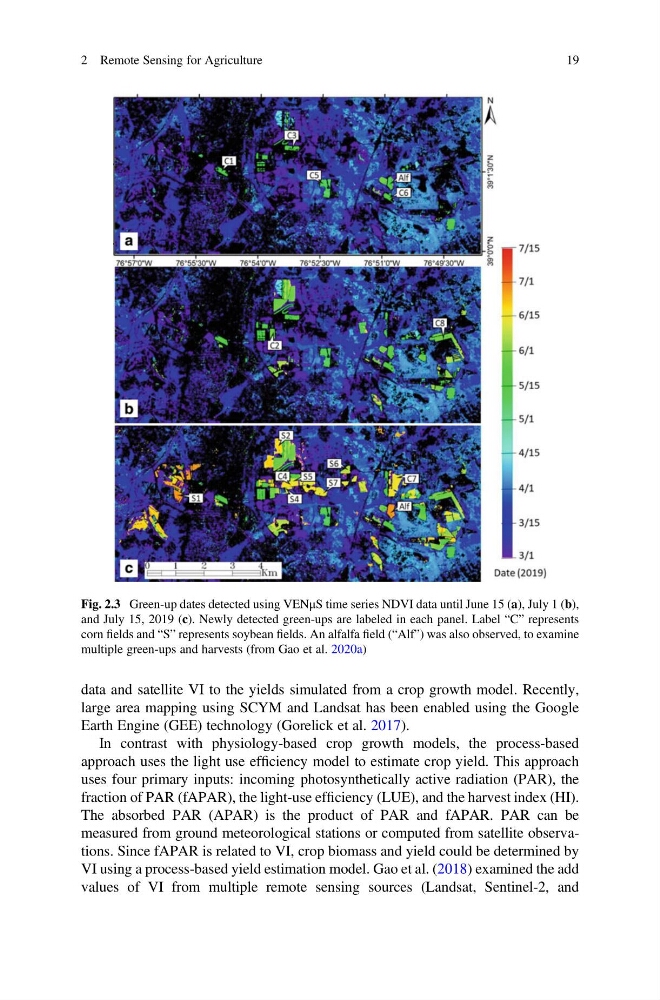
Fig. 2.3 Green-up dates detected using VENμS time series NDVI data until June 15 (a), July 1 (b),
and July 15, 2019 (c). Newly detected green-ups are labeled in each panel. Label “C” represents
corn fields and “S” represents soybean fields. An alfalfa field (“Alf”) was also observed, to examine
multiple green-ups and harvests (from Gao et al. 2020a)
2 Remote Sensing for Agriculture
19
large area mapping using SCYM and Landsat has been enabled using the Google
Earth Engine (GEE) technology (Gorelick et al. 2017).
In contrast with physiology-based crop growth models, the process-based
approach uses the light use efficiency model to estimate crop yield. This approach
uses four primary inputs: incoming photosynthetically active radiation (PAR), the
fraction of PAR (fAPAR), the light-use efficiency (LUE), and the harvest index (HI).
The absorbed PAR (APAR) is the product of PAR and fAPAR. PAR can be
measured from ground meteorological stations or computed from satellite observations. Since fAPAR is related to VI, crop biomass and yield could be determined by
VI using a process-based yield estimation model. Gao et al. (2018) examined the add
values of VI from multiple remote sensing sources (Landsat, Sentinel-2, and
Fig. 2.3 Green-up dates detected using VENμS time series NDVI data until June 15 (a), July 1 (b),
and July 15, 2019 (c). Newly detected green-ups are labeled in each panel. Label “C” represents
corn fields and “S” represents soybean fields. An alfalfa field (“Alf”) was also observed, to examine
multiple green-ups and harvests (from Gao et al. 2020a)
2 Remote Sensing for Agriculture
19