

throughout the project period, and completed by the end of August 2016. In total,
2147 GCPs were obtained, 1457 GCPs for aerial images and 690 GCPs for satellite
images.
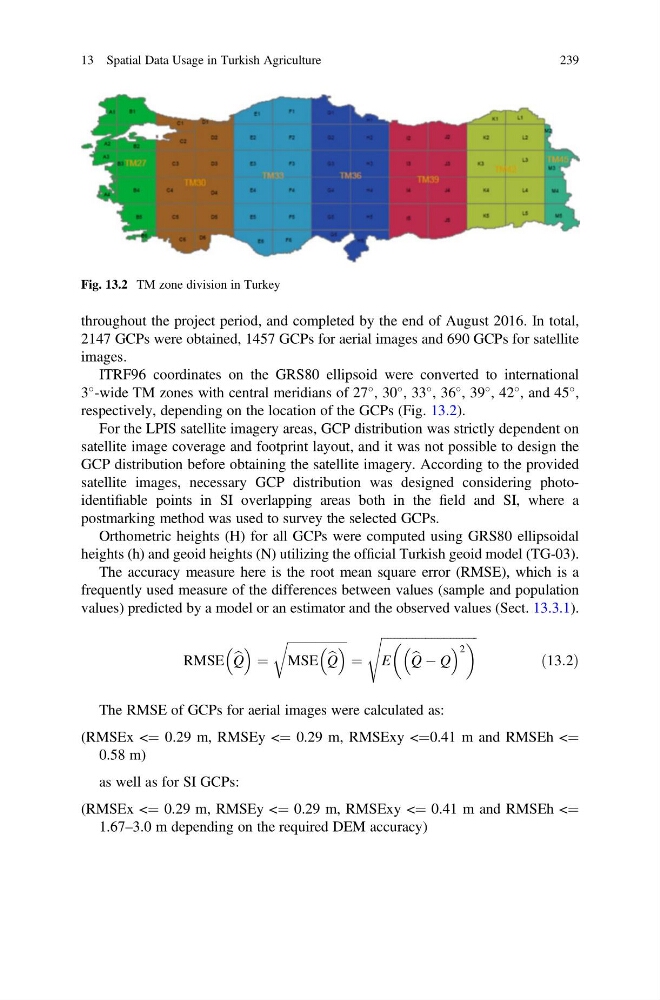
ITRF96 coordinates on the GRS80 ellipsoid were converted to international
3
-wide TM zones with central meridians of 27
, 30
, 33
, 36
, 39
, 42
, and 45
,
respectively, depending on the location of the GCPs (Fig. 13.2).
For the LPIS satellite imagery areas, GCP distribution was strictly dependent on
satellite image coverage and footprint layout, and it was not possible to design the
GCP distribution before obtaining the satellite imagery. According to the provided
satellite images, necessary GCP distribution was designed considering photoidentifiable points in SI overlapping areas both in the field and SI, where a
postmarking method was used to survey the selected GCPs.
Orthometric heights (H) for all GCPs were computed using GRS80 ellipsoidal
heights (h) and geoid heights (N) utilizing the official Turkish geoid model (TG-03).
The accuracy measure here is the root mean square error (RMSE), which is a
frequently used measure of the differences between values (sample and population
values) predicted by a model or an estimator and the observed values (Sect. 13.3.1).
RMSE b
Q
¼
ffiffiffiffiffiffiffiffiffiffiffiffiffiffiffiffiffiffiffi
MSE b
Q
r
¼
ffiffiffiffiffiffiffiffiffiffiffiffiffiffiffiffiffiffiffiffiffiffiffiffiffiffiffiffiffiffi ffi
E b
Q À Q
2
s
ð13:2Þ
The RMSE of GCPs for aerial images were calculated as:
(RMSEx <¼ 0.29 m, RMSEy <¼ 0.29 m, RMSExy <¼0.41 m and RMSEh <¼
0.58 m)
as well as for SI GCPs:
(RMSEx <¼ 0.29 m, RMSEy <¼ 0.29 m, RMSExy <¼ 0.41 m and RMSEh <¼
1.67–3.0 m depending on the required DEM accuracy)
Fig. 13.2 TM zone division in Turkey
13 Spatial Data Usage in Turkish Agriculture
239
2147 GCPs were obtained, 1457 GCPs for aerial images and 690 GCPs for satellite
images.
ITRF96 coordinates on the GRS80 ellipsoid were converted to international
3
-wide TM zones with central meridians of 27
, 30
, 33
, 36
, 39
, 42
, and 45
,
respectively, depending on the location of the GCPs (Fig. 13.2).
For the LPIS satellite imagery areas, GCP distribution was strictly dependent on
satellite image coverage and footprint layout, and it was not possible to design the
GCP distribution before obtaining the satellite imagery. According to the provided
satellite images, necessary GCP distribution was designed considering photoidentifiable points in SI overlapping areas both in the field and SI, where a
postmarking method was used to survey the selected GCPs.
Orthometric heights (H) for all GCPs were computed using GRS80 ellipsoidal
heights (h) and geoid heights (N) utilizing the official Turkish geoid model (TG-03).
The accuracy measure here is the root mean square error (RMSE), which is a
frequently used measure of the differences between values (sample and population
values) predicted by a model or an estimator and the observed values (Sect. 13.3.1).
RMSE b
Q
¼
ffiffiffiffiffiffiffiffiffiffiffiffiffiffiffiffiffiffiffi
MSE b
Q
r
¼
ffiffiffiffiffiffiffiffiffiffiffiffiffiffiffiffiffiffiffiffiffiffiffiffiffiffiffiffiffiffi ffi
E b
Q À Q
2
s
ð13:2Þ
The RMSE of GCPs for aerial images were calculated as:
(RMSEx <¼ 0.29 m, RMSEy <¼ 0.29 m, RMSExy <¼0.41 m and RMSEh <¼
0.58 m)
as well as for SI GCPs:
(RMSEx <¼ 0.29 m, RMSEy <¼ 0.29 m, RMSExy <¼ 0.41 m and RMSEh <¼
1.67–3.0 m depending on the required DEM accuracy)
Fig. 13.2 TM zone division in Turkey
13 Spatial Data Usage in Turkish Agriculture
239