

Among these parameters, the DEM and slope map was acquired from the General
Command of Mapping; the others are from MoFAL.
(c) Calculation of Yield Coefficient.
Since the input criteria layers had different numbering systems with different
ranges, to combine them in a single analysis, each cell for each criterion was
reclassified using a common preference scale from 1 to 10, with 10 being the most
favorable. After the model was run, the resulting yield maps were obtained for each
of the 81 provinces.
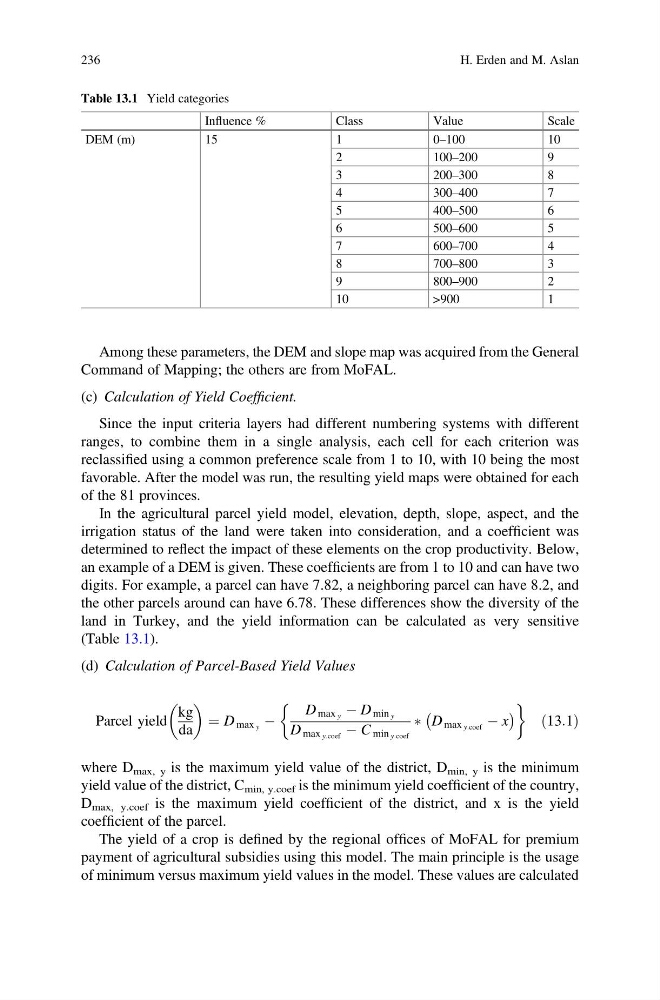
In the agricultural parcel yield model, elevation, depth, slope, aspect, and the
irrigation status of the land were taken into consideration, and a coefficient was
determined to reflect the impact of these elements on the crop productivity. Below,
an example of a DEM is given. These coefficients are from 1 to 10 and can have two
digits. For example, a parcel can have 7.82, a neighboring parcel can have 8.2, and
the other parcels around can have 6.78. These differences show the diversity of the
land in Turkey, and the yield information can be calculated as very sensitive
(Table 13.1).
(d) Calculation of Parcel-Based Yield Values
Parcel yield
kg
da
¼ D max y À
D max y À D min y
D max y:coef À C min y:coef
à D max y:coef À x
À
Á
&
'
ð13:1Þ
where D max, y is the maximum yield value of the district, D min, y is the minimum
yield value of the district, C min, y.coef is the minimum yield coefficient of the country,
D max, y.coef is the maximum yield coefficient of the district, and x is the yield
coefficient of the parcel.
The yield of a crop is defined by the regional offices of MoFAL for premium
payment of agricultural subsidies using this model. The main principle is the usage
of minimum versus maximum yield values in the model. These values are calculated
Table 13.1 Yield categories
Influence %
Class
Value
Scale
DEM (m)
15
1
0–100
10
2
100–200
9
3
200–300
8
4
300–400
7
5
400–500
6
6
500–600
5
7
600–700
4
8
700–800
3
9
800–900
2
10
>900
1
236
H. Erden and M. Aslan
Command of Mapping; the others are from MoFAL.
(c) Calculation of Yield Coefficient.
Since the input criteria layers had different numbering systems with different
ranges, to combine them in a single analysis, each cell for each criterion was
reclassified using a common preference scale from 1 to 10, with 10 being the most
favorable. After the model was run, the resulting yield maps were obtained for each
of the 81 provinces.
In the agricultural parcel yield model, elevation, depth, slope, aspect, and the
irrigation status of the land were taken into consideration, and a coefficient was
determined to reflect the impact of these elements on the crop productivity. Below,
an example of a DEM is given. These coefficients are from 1 to 10 and can have two
digits. For example, a parcel can have 7.82, a neighboring parcel can have 8.2, and
the other parcels around can have 6.78. These differences show the diversity of the
land in Turkey, and the yield information can be calculated as very sensitive
(Table 13.1).
(d) Calculation of Parcel-Based Yield Values
Parcel yield
kg
da
¼ D max y À
D max y À D min y
D max y:coef À C min y:coef
à D max y:coef À x
À
Á
&
'
ð13:1Þ
where D max, y is the maximum yield value of the district, D min, y is the minimum
yield value of the district, C min, y.coef is the minimum yield coefficient of the country,
D max, y.coef is the maximum yield coefficient of the district, and x is the yield
coefficient of the parcel.
The yield of a crop is defined by the regional offices of MoFAL for premium
payment of agricultural subsidies using this model. The main principle is the usage
of minimum versus maximum yield values in the model. These values are calculated
Table 13.1 Yield categories
Influence %
Class
Value
Scale
DEM (m)
15
1
0–100
10
2
100–200
9
3
200–300
8
4
300–400
7
5
400–500
6
6
500–600
5
7
600–700
4
8
700–800
3
9
800–900
2
10
>900
1
236
H. Erden and M. Aslan