

Flight Center and Dartmouth Flood Observatory (DFO) in the University of Colorado are powered by the system. RF-CLASS also provides the monthly, annually,
improved annually, frequency, improved frequency flood data products; moreover, it
provides the advanced annual flood event data, crop fraction, and crop loss data
products. The RF-CLASS data component mainly utilized the EO data (e.g., NASA
MODIS NDVI at 250 m spatial resolution) and the daily flood map data for
processing the flood damage assessment information. The data component also
accesses other data resources, such as the Cropland Data Layer (CDL) from NASS
(Boryan et al. 2011; Han et al. 2012), which is used as the primary source of crop
types, the Common Land Unit (CLU) and 578 administrative data from Farm
Service Agency (FSA 2012), meteorological precipitation data, and the auxiliary
vector data files (e.g., US state/county/ASD/region boundaries, US road data, US
water data, crop mask data).
The RF-CLASS Web portal is presented to allow the users better visualizing and
downloading the flood-related data products (RF-CLASS 2017). The portal has
basic map operation (e.g., zoom in/out, drag box zoom in, pan, refresh, and thumbnails preview), data manipulation (e.g., data query, layer selection, layer
add/remove/edit, and data download), and dynamic time-series data displaying and
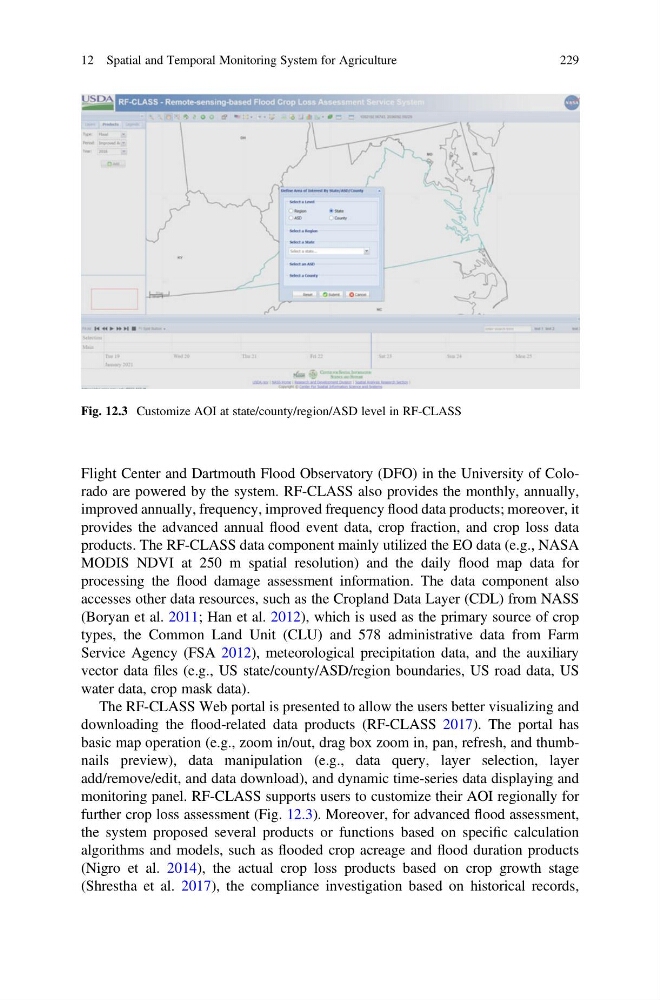
monitoring panel. RF-CLASS supports users to customize their AOI regionally for
further crop loss assessment (Fig. 12.3). Moreover, for advanced flood assessment,
the system proposed several products or functions based on specific calculation
algorithms and models, such as flooded crop acreage and flood duration products
(Nigro et al. 2014), the actual crop loss products based on crop growth stage
(Shrestha et al. 2017), the compliance investigation based on historical records,
Fig. 12.3 Customize AOI at state/county/region/ASD level in RF-CLASS
12 Spatial and Temporal Monitoring System for Agriculture
229
improved annually, frequency, improved frequency flood data products; moreover, it
provides the advanced annual flood event data, crop fraction, and crop loss data
products. The RF-CLASS data component mainly utilized the EO data (e.g., NASA
MODIS NDVI at 250 m spatial resolution) and the daily flood map data for
processing the flood damage assessment information. The data component also
accesses other data resources, such as the Cropland Data Layer (CDL) from NASS
(Boryan et al. 2011; Han et al. 2012), which is used as the primary source of crop
types, the Common Land Unit (CLU) and 578 administrative data from Farm
Service Agency (FSA 2012), meteorological precipitation data, and the auxiliary
vector data files (e.g., US state/county/ASD/region boundaries, US road data, US
water data, crop mask data).
The RF-CLASS Web portal is presented to allow the users better visualizing and
downloading the flood-related data products (RF-CLASS 2017). The portal has
basic map operation (e.g., zoom in/out, drag box zoom in, pan, refresh, and thumbnails preview), data manipulation (e.g., data query, layer selection, layer
add/remove/edit, and data download), and dynamic time-series data displaying and
monitoring panel. RF-CLASS supports users to customize their AOI regionally for
further crop loss assessment (Fig. 12.3). Moreover, for advanced flood assessment,
the system proposed several products or functions based on specific calculation
algorithms and models, such as flooded crop acreage and flood duration products
(Nigro et al. 2014), the actual crop loss products based on crop growth stage
(Shrestha et al. 2017), the compliance investigation based on historical records,
Fig. 12.3 Customize AOI at state/county/region/ASD level in RF-CLASS
12 Spatial and Temporal Monitoring System for Agriculture
229