

part of the system is semiautomated, the phenological stages of the cereals at
observation parcels are determined through an image processing software (Bagis
and Üstündağ 2012), and operators verify the suspicious data.
A conventional approach in crop yield efficiency estimation is using the statistical
correlations between the observed seasonal parameters and crop yield efficiency data
(Herndl 2008). Choosing the highest correlating parameters having the least low
covariance is important for the estimation performance of the regression models.
Multiple linear regressions may not provide accurate relationship when cumulative
seasonal data is used for the estimation of yield depending on the normalized
difference vegetation index (NDVI) and agrometeorological parameters. Besides
using nonlinear regression models, the piecewise linear multiple regression for
phenological stage group intervals also improves the estimation performance.
Regression analysis dependent on NDVI as a remote sensing parameter, rainfall,
and other agrometeorological indices are widely used with statistical models
(Balaghi et al. 2008). Another approach is using crop system models such as
CropSyst. Common computational platforms are also a way of applying crop system
models as in the case of BioMa (Rouse et al. 1973). A wide variety of computational
methods such as neural networks, self-identification, and statistical learning methods
are used to determine the model parameters either in supervisory or adaptive modes.
Another common approach is the supervised classification where remote sensing
data is used together with terrestrial observations. As in the case of animals, plants
also have different responses to the physical environment depending on their
phenological stage (Dong et al. 2014; Herndl 2008).
The main idea behind the improvement of yield efficiency is not only choosing
the highest correlating parameters but also grouping them in terms of phenological
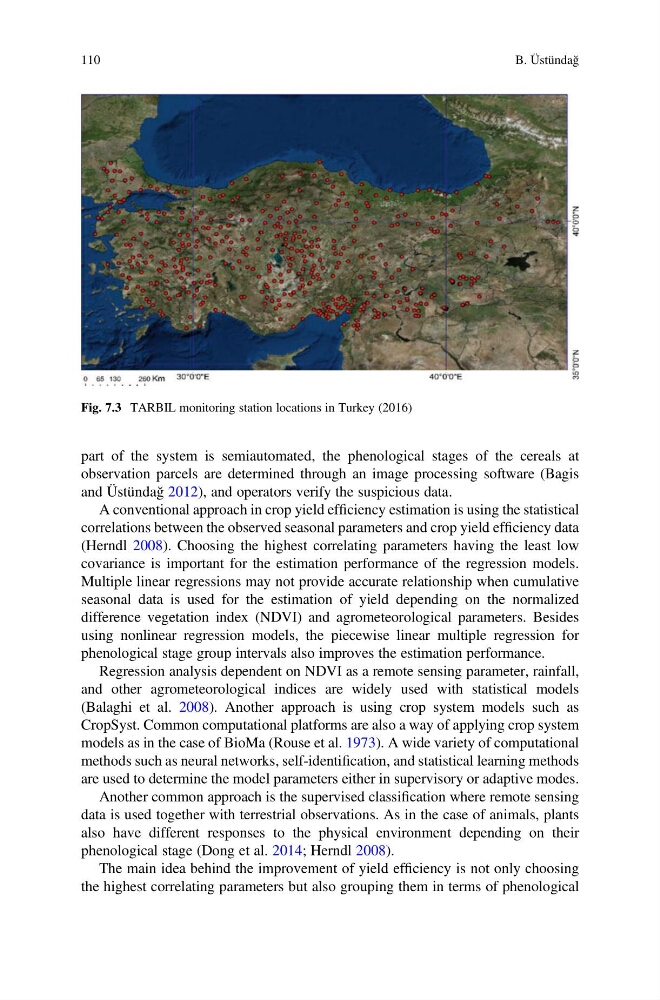
Fig. 7.3 TARBIL monitoring station locations in Turkey (2016)
110
B. Üstündağ
observation parcels are determined through an image processing software (Bagis
and Üstündağ 2012), and operators verify the suspicious data.
A conventional approach in crop yield efficiency estimation is using the statistical
correlations between the observed seasonal parameters and crop yield efficiency data
(Herndl 2008). Choosing the highest correlating parameters having the least low
covariance is important for the estimation performance of the regression models.
Multiple linear regressions may not provide accurate relationship when cumulative
seasonal data is used for the estimation of yield depending on the normalized
difference vegetation index (NDVI) and agrometeorological parameters. Besides
using nonlinear regression models, the piecewise linear multiple regression for
phenological stage group intervals also improves the estimation performance.
Regression analysis dependent on NDVI as a remote sensing parameter, rainfall,
and other agrometeorological indices are widely used with statistical models
(Balaghi et al. 2008). Another approach is using crop system models such as
CropSyst. Common computational platforms are also a way of applying crop system
models as in the case of BioMa (Rouse et al. 1973). A wide variety of computational
methods such as neural networks, self-identification, and statistical learning methods
are used to determine the model parameters either in supervisory or adaptive modes.
Another common approach is the supervised classification where remote sensing
data is used together with terrestrial observations. As in the case of animals, plants
also have different responses to the physical environment depending on their
phenological stage (Dong et al. 2014; Herndl 2008).
The main idea behind the improvement of yield efficiency is not only choosing
the highest correlating parameters but also grouping them in terms of phenological
Fig. 7.3 TARBIL monitoring station locations in Turkey (2016)
110
B. Üstündağ