

96.4% (the detail of CDL metadata could be accessed at https://www.nass.usda.gov/
Research_and_Science/Cropland/metadata/meta.php).
The CDL data products could be accessed, visualized, interacted, and
downloaded from CropScape portal (https://nassgeodata.gmu.edu/CropScape),
which is a geospatial web application developed in cooperation with the Center for
Spatial Information Science and Systems, George Mason University (Han et al.
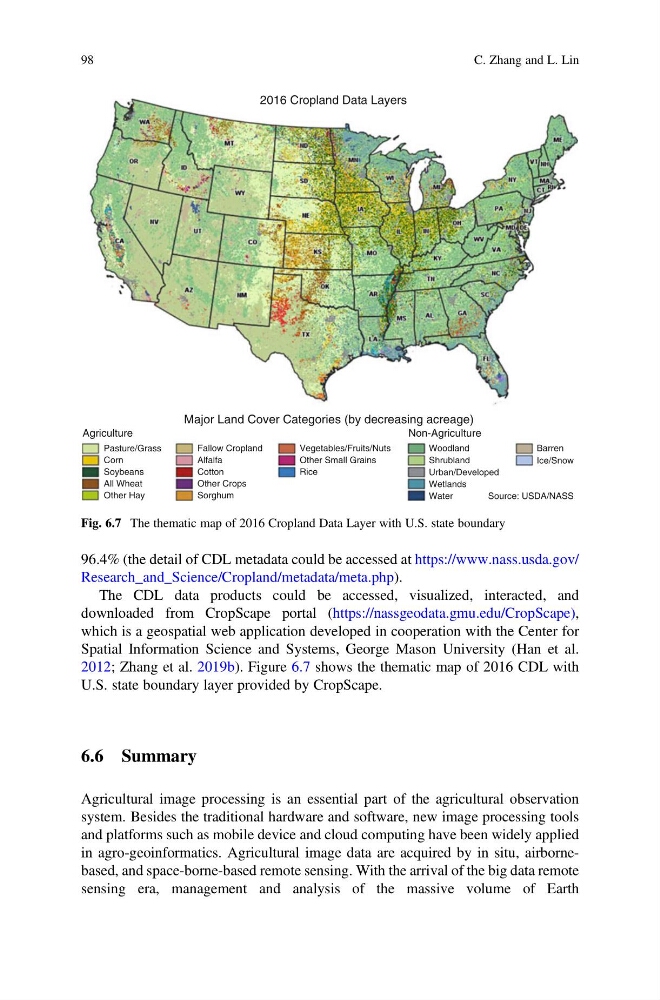
2012; Zhang et al. 2019b). Figure 6.7 shows the thematic map of 2016 CDL with
U.S. state boundary layer provided by CropScape.
6.6 Summary
Agricultural image processing is an essential part of the agricultural observation
system. Besides the traditional hardware and software, new image processing tools
and platforms such as mobile device and cloud computing have been widely applied
in agro-geoinformatics. Agricultural image data are acquired by in situ, airbornebased, and space-borne-based remote sensing. With the arrival of the big data remote
sensing era, management and analysis of the massive volume of Earth
Major Land Cover Categories (by decreasing acreage)
2016 Cropland Data Layers
Agriculture
Non-Agriculture
Pasture/Grass
Corn
Soybeans
All Wheat
Other Hay
Fallow Cropland
Alfalfa
Cotton
Other Crops
Sorghum
Vegetables/Fruits/Nuts
Other Small Grains
Rice
Woodland
Shrubland
Urban/Developed
Wetlands
Water
Source: USDA/NASS
Barren
Ice/Snow
Fig. 6.7 The thematic map of 2016 Cropland Data Layer with U.S. state boundary
98
C. Zhang and L. Lin
Research_and_Science/Cropland/metadata/meta.php).
The CDL data products could be accessed, visualized, interacted, and
downloaded from CropScape portal (https://nassgeodata.gmu.edu/CropScape),
which is a geospatial web application developed in cooperation with the Center for
Spatial Information Science and Systems, George Mason University (Han et al.
2012; Zhang et al. 2019b). Figure 6.7 shows the thematic map of 2016 CDL with
U.S. state boundary layer provided by CropScape.
6.6 Summary
Agricultural image processing is an essential part of the agricultural observation
system. Besides the traditional hardware and software, new image processing tools
and platforms such as mobile device and cloud computing have been widely applied
in agro-geoinformatics. Agricultural image data are acquired by in situ, airbornebased, and space-borne-based remote sensing. With the arrival of the big data remote
sensing era, management and analysis of the massive volume of Earth
Major Land Cover Categories (by decreasing acreage)
2016 Cropland Data Layers
Agriculture
Non-Agriculture
Pasture/Grass
Corn
Soybeans
All Wheat
Other Hay
Fallow Cropland
Alfalfa
Cotton
Other Crops
Sorghum
Vegetables/Fruits/Nuts
Other Small Grains
Rice
Woodland
Shrubland
Urban/Developed
Wetlands
Water
Source: USDA/NASS
Barren
Ice/Snow
Fig. 6.7 The thematic map of 2016 Cropland Data Layer with U.S. state boundary
98
C. Zhang and L. Lin