

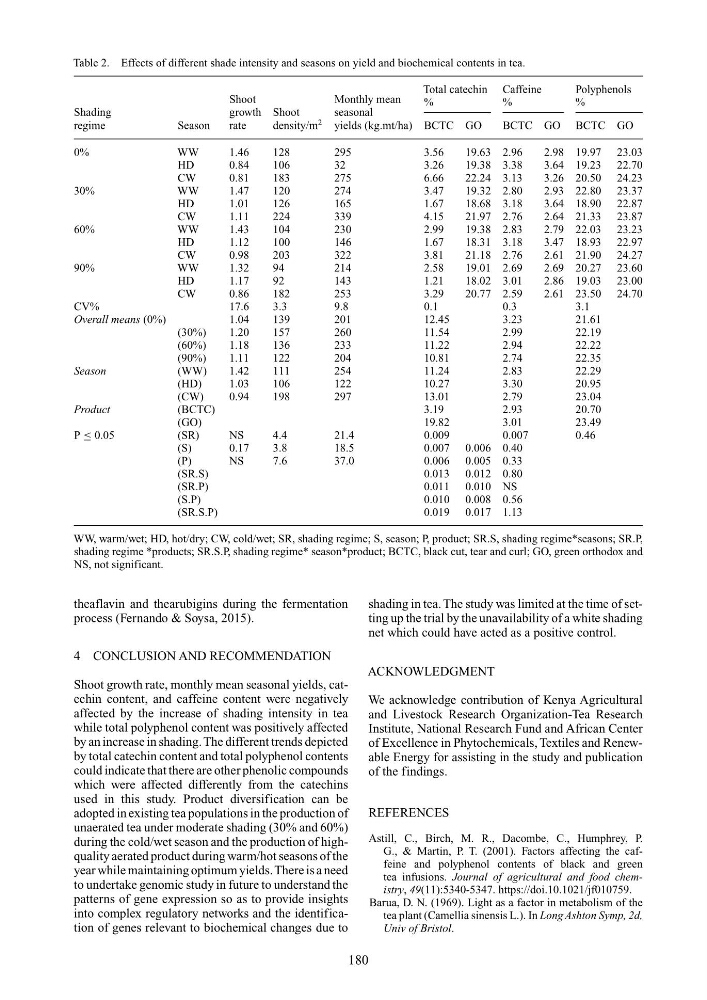
Table 2. Effects of different shade intensity and seasons on yield and biochemical contents in tea.
Total catechin Caffeine
Polyphenols
%
%
%
Shoot
Monthly mean
Shading
growth Shoot
seasonal
regime
Season
rate
density/m
2
yields (kg.mt/ha) BCTC GO
BCTC GO BCTC GO
0%
WW
1.46
128
295
3.56
19.63 2.96
2.98 19.97 23.03
HD
0.84
106
32
3.26
19.38 3.38
3.64 19.23 22.70
CW
0.81
183
275
6.66
22.24 3.13
3.26 20.50 24.23
30%
WW
1.47
120
274
3.47
19.32 2.80
2.93 22.80 23.37
HD
1.01
126
165
1.67
18.68 3.18
3.64 18.90 22.87
CW
1.11
224
339
4.15
21.97 2.76
2.64 21.33 23.87
60%
WW
1.43
104
230
2.99
19.38 2.83
2.79 22.03 23.23
HD
1.12
100
146
1.67
18.31 3.18
3.47 18.93 22.97
CW
0.98
203
322
3.81
21.18 2.76
2.61 21.90 24.27
90%
WW
1.32
94
214
2.58
19.01 2.69
2.69 20.27 23.60
HD
1.17
92
143
1.21
18.02 3.01
2.86 19.03 23.00
CW
0.86
182
253
3.29
20.77 2.59
2.61 23.50 24.70
CV%
17.6
3.3
9.8
0.1
0.3
3.1
Overall means (0%)
1.04
139
201
12.45
3.23
21.61
(30%)
1.20
157
260
11.54
2.99
22.19
(60%)
1.18
136
233
11.22
2.94
22.22
(90%)
1.11
122
204
10.81
2.74
22.35
Season
(WW)
1.42
111
254
11.24
2.83
22.29
(HD)
1.03
106
122
10.27
3.30
20.95
(CW)
0.94
198
297
13.01
2.79
23.04
Product
(BCTC)
3.19
2.93
20.70
(GO)
19.82
3.01
23.49
P ≤ 0.05
(SR)
NS
4.4
21.4
0.009
0.007
0.46
(S)
0.17
3.8
18.5
0.007 0.006 0.40
(P)
NS
7.6
37.0
0.006 0.005 0.33
(SR.S)
0.013 0.012 0.80
(SR.P)
0.011 0.010 NS
(S.P)
0.010 0.008 0.56
(SR.S.P)
0.019 0.017 1.13
WW, warm/wet; HD, hot/dry; CW, cold/wet; SR, shading regime; S, season; P, product; SR.S, shading regime*seasons; SR.P,
shading regime *products; SR.S.P, shading regime* season*product; BCTC, black cut, tear and curl; GO, green orthodox and
NS, not significant.
theaflavin and thearubigins during the fermentation
process (Fernando & Soysa, 2015).
4 CONCLUSION AND RECOMMENDATION
Shoot growth rate, monthly mean seasonal yields, catechin content, and caffeine content were negatively
affected by the increase of shading intensity in tea
while total polyphenol content was positively affected
by an increase in shading. The different trends depicted
by total catechin content and total polyphenol contents
could indicate that there are other phenolic compounds
which were affected differently from the catechins
used in this study. Product diversification can be
adopted in existing tea populations in the production of
unaerated tea under moderate shading (30% and 60%)
during the cold/wet season and the production of highquality aerated product during warm/hot seasons of the
year while maintaining optimum yields.There is a need
to undertake genomic study in future to understand the
patterns of gene expression so as to provide insights
into complex regulatory networks and the identification of genes relevant to biochemical changes due to
shading in tea. The study was limited at the time of setting up the trial by the unavailability of a white shading
net which could have acted as a positive control.
ACKNOWLEDGMENT
We acknowledge contribution of Kenya Agricultural
and Livestock Research Organization-Tea Research
Institute, National Research Fund and African Center
of Excellence in Phytochemicals, Textiles and Renewable Energy for assisting in the study and publication
of the findings.
REFERENCES
Astill, C., Birch, M. R., Dacombe, C., Humphrey, P.
G., & Martin, P. T. (2001). Factors affecting the caffeine and polyphenol contents of black and green
tea infusions. Journal of agricultural and food chemistry, 49(11):5340-5347. https://doi.10.1021/jf010759.
Barua, D. N. (1969). Light as a factor in metabolism of the
tea plant (Camellia sinensis L.). In Long Ashton Symp, 2d,
Univ of Bristol.
180
Total catechin Caffeine
Polyphenols
%
%
%
Shoot
Monthly mean
Shading
growth Shoot
seasonal
regime
Season
rate
density/m
2
yields (kg.mt/ha) BCTC GO
BCTC GO BCTC GO
0%
WW
1.46
128
295
3.56
19.63 2.96
2.98 19.97 23.03
HD
0.84
106
32
3.26
19.38 3.38
3.64 19.23 22.70
CW
0.81
183
275
6.66
22.24 3.13
3.26 20.50 24.23
30%
WW
1.47
120
274
3.47
19.32 2.80
2.93 22.80 23.37
HD
1.01
126
165
1.67
18.68 3.18
3.64 18.90 22.87
CW
1.11
224
339
4.15
21.97 2.76
2.64 21.33 23.87
60%
WW
1.43
104
230
2.99
19.38 2.83
2.79 22.03 23.23
HD
1.12
100
146
1.67
18.31 3.18
3.47 18.93 22.97
CW
0.98
203
322
3.81
21.18 2.76
2.61 21.90 24.27
90%
WW
1.32
94
214
2.58
19.01 2.69
2.69 20.27 23.60
HD
1.17
92
143
1.21
18.02 3.01
2.86 19.03 23.00
CW
0.86
182
253
3.29
20.77 2.59
2.61 23.50 24.70
CV%
17.6
3.3
9.8
0.1
0.3
3.1
Overall means (0%)
1.04
139
201
12.45
3.23
21.61
(30%)
1.20
157
260
11.54
2.99
22.19
(60%)
1.18
136
233
11.22
2.94
22.22
(90%)
1.11
122
204
10.81
2.74
22.35
Season
(WW)
1.42
111
254
11.24
2.83
22.29
(HD)
1.03
106
122
10.27
3.30
20.95
(CW)
0.94
198
297
13.01
2.79
23.04
Product
(BCTC)
3.19
2.93
20.70
(GO)
19.82
3.01
23.49
P ≤ 0.05
(SR)
NS
4.4
21.4
0.009
0.007
0.46
(S)
0.17
3.8
18.5
0.007 0.006 0.40
(P)
NS
7.6
37.0
0.006 0.005 0.33
(SR.S)
0.013 0.012 0.80
(SR.P)
0.011 0.010 NS
(S.P)
0.010 0.008 0.56
(SR.S.P)
0.019 0.017 1.13
WW, warm/wet; HD, hot/dry; CW, cold/wet; SR, shading regime; S, season; P, product; SR.S, shading regime*seasons; SR.P,
shading regime *products; SR.S.P, shading regime* season*product; BCTC, black cut, tear and curl; GO, green orthodox and
NS, not significant.
theaflavin and thearubigins during the fermentation
process (Fernando & Soysa, 2015).
4 CONCLUSION AND RECOMMENDATION
Shoot growth rate, monthly mean seasonal yields, catechin content, and caffeine content were negatively
affected by the increase of shading intensity in tea
while total polyphenol content was positively affected
by an increase in shading. The different trends depicted
by total catechin content and total polyphenol contents
could indicate that there are other phenolic compounds
which were affected differently from the catechins
used in this study. Product diversification can be
adopted in existing tea populations in the production of
unaerated tea under moderate shading (30% and 60%)
during the cold/wet season and the production of highquality aerated product during warm/hot seasons of the
year while maintaining optimum yields.There is a need
to undertake genomic study in future to understand the
patterns of gene expression so as to provide insights
into complex regulatory networks and the identification of genes relevant to biochemical changes due to
shading in tea. The study was limited at the time of setting up the trial by the unavailability of a white shading
net which could have acted as a positive control.
ACKNOWLEDGMENT
We acknowledge contribution of Kenya Agricultural
and Livestock Research Organization-Tea Research
Institute, National Research Fund and African Center
of Excellence in Phytochemicals, Textiles and Renewable Energy for assisting in the study and publication
of the findings.
REFERENCES
Astill, C., Birch, M. R., Dacombe, C., Humphrey, P.
G., & Martin, P. T. (2001). Factors affecting the caffeine and polyphenol contents of black and green
tea infusions. Journal of agricultural and food chemistry, 49(11):5340-5347. https://doi.10.1021/jf010759.
Barua, D. N. (1969). Light as a factor in metabolism of the
tea plant (Camellia sinensis L.). In Long Ashton Symp, 2d,
Univ of Bristol.
180