

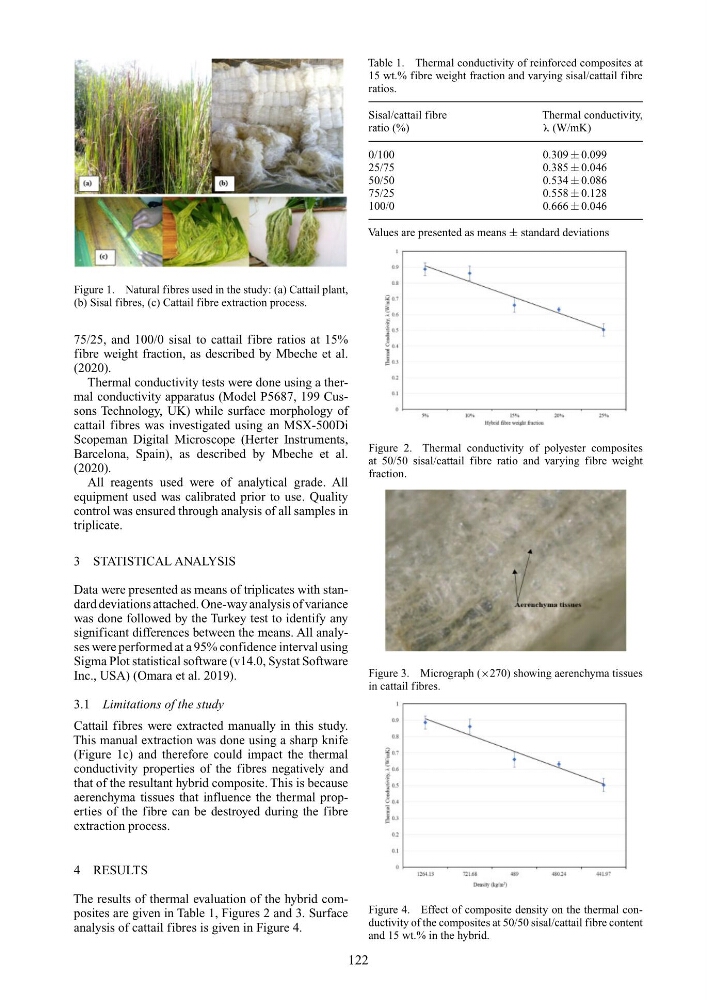
Figure 1. Natural fibres used in the study: (a) Cattail plant,
(b) Sisal fibres, (c) Cattail fibre extraction process.
75/25, and 100/0 sisal to cattail fibre ratios at 15%
fibre weight fraction, as described by Mbeche et al.
(2020).
Thermal conductivity tests were done using a thermal conductivity apparatus (Model P5687, 199 Cussons Technology, UK) while surface morphology of
cattail fibres was investigated using an MSX-500Di
Scopeman Digital Microscope (Herter Instruments,
Barcelona, Spain), as described by Mbeche et al.
(2020).
All reagents used were of analytical grade. All
equipment used was calibrated prior to use. Quality
control was ensured through analysis of all samples in
triplicate.
3 STATISTICAL ANALYSIS
Data were presented as means of triplicates with standard deviations attached. One-way analysis of variance
was done followed by the Turkey test to identify any
significant differences between the means. All analyses were performed at a 95% confidence interval using
Sigma Plot statistical software (v14.0, Systat Software
Inc., USA) (Omara et al. 2019).
3.1 Limitations of the study
Cattail fibres were extracted manually in this study.
This manual extraction was done using a sharp knife
(Figure 1c) and therefore could impact the thermal
conductivity properties of the fibres negatively and
that of the resultant hybrid composite. This is because
aerenchyma tissues that influence the thermal properties of the fibre can be destroyed during the fibre
extraction process.
4 RESULTS
The results of thermal evaluation of the hybrid composites are given in Table 1, Figures 2 and 3. Surface
analysis of cattail fibres is given in Figure 4.
Table 1. Thermal conductivity of reinforced composites at
15 wt.% fibre weight fraction and varying sisal/cattail fibre
ratios.
Sisal/cattail fibre
Thermal conductivity,
ratio (%)
λ (W/mK)
0/100
0.309 ± 0.099
25/75
0.385 ± 0.046
50/50
0.534 ± 0.086
75/25
0.558 ± 0.128
100/0
0.666 ± 0.046
Values are presented as means ± standard deviations
Figure 2. Thermal conductivity of polyester composites
at 50/50 sisal/cattail fibre ratio and varying fibre weight
fraction.
Figure 3. Micrograph (×270) showing aerenchyma tissues
in cattail fibres.
Figure 4. Effect of composite density on the thermal conductivity of the composites at 50/50 sisal/cattail fibre content
and 15 wt.% in the hybrid.
122
(b) Sisal fibres, (c) Cattail fibre extraction process.
75/25, and 100/0 sisal to cattail fibre ratios at 15%
fibre weight fraction, as described by Mbeche et al.
(2020).
Thermal conductivity tests were done using a thermal conductivity apparatus (Model P5687, 199 Cussons Technology, UK) while surface morphology of
cattail fibres was investigated using an MSX-500Di
Scopeman Digital Microscope (Herter Instruments,
Barcelona, Spain), as described by Mbeche et al.
(2020).
All reagents used were of analytical grade. All
equipment used was calibrated prior to use. Quality
control was ensured through analysis of all samples in
triplicate.
3 STATISTICAL ANALYSIS
Data were presented as means of triplicates with standard deviations attached. One-way analysis of variance
was done followed by the Turkey test to identify any
significant differences between the means. All analyses were performed at a 95% confidence interval using
Sigma Plot statistical software (v14.0, Systat Software
Inc., USA) (Omara et al. 2019).
3.1 Limitations of the study
Cattail fibres were extracted manually in this study.
This manual extraction was done using a sharp knife
(Figure 1c) and therefore could impact the thermal
conductivity properties of the fibres negatively and
that of the resultant hybrid composite. This is because
aerenchyma tissues that influence the thermal properties of the fibre can be destroyed during the fibre
extraction process.
4 RESULTS
The results of thermal evaluation of the hybrid composites are given in Table 1, Figures 2 and 3. Surface
analysis of cattail fibres is given in Figure 4.
Table 1. Thermal conductivity of reinforced composites at
15 wt.% fibre weight fraction and varying sisal/cattail fibre
ratios.
Sisal/cattail fibre
Thermal conductivity,
ratio (%)
λ (W/mK)
0/100
0.309 ± 0.099
25/75
0.385 ± 0.046
50/50
0.534 ± 0.086
75/25
0.558 ± 0.128
100/0
0.666 ± 0.046
Values are presented as means ± standard deviations
Figure 2. Thermal conductivity of polyester composites
at 50/50 sisal/cattail fibre ratio and varying fibre weight
fraction.
Figure 3. Micrograph (×270) showing aerenchyma tissues
in cattail fibres.
Figure 4. Effect of composite density on the thermal conductivity of the composites at 50/50 sisal/cattail fibre content
and 15 wt.% in the hybrid.
122