

111
Pesticides in Fog
TABLE 7.2
Aqueous-Phase Enrichment Factors (K AW / D) for the Distribution of
Pesticides between Fogwater and Air
Compound
1/8–9
1/9
1/11 a
1/12
1/12–13
Mean
Diazinon
6
59
14
50
160
58
Parathion
4
12
5
18
29
14
Chlorpyrifos
7
55
3.5
40
74
42
Methidathion
0.06
3
0.02
1.4
2.3
1.4
Paraoxon
2.1
14
10
48
>69
>19
Source: Reprinted (adapted) with permission from Glotfelty, D.E., Majewski,
M.S., and Seiber, J.N. (1990b). Distribution of several organophosphorus
insecticides and their OAs in a foggy atmosphere. Environ. Sci. Technol.
24, 353–357. Copyright (1990) American Chemical Society.
a Hills Valley Road site.
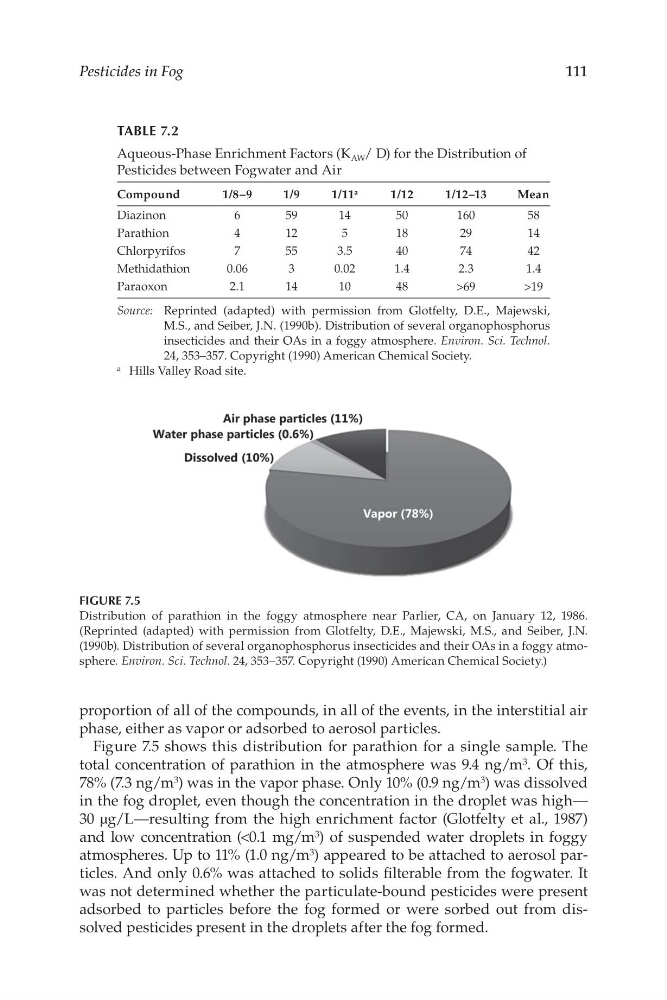
FIGURE 7.5
Distribution of parathion in the foggy atmosphere near Parlier, CA, on January 12, 1986.
(Reprinted (adapted) with permission from Glotfelty, D.E., Majewski, M.S., and Seiber, J.N.
(1990b). Distribution of several organophosphorus insecticides and their OAs in a foggy atmosphere. Environ. Sci. Technol. 24, 353–357. Copyright (1990) American Chemical Society.)
proportion of all of the compounds, in all of the events, in the interstitial air
phase, either as vapor or adsorbed to aerosol particles.
Figure 7.5 shows this distribution for parathion for a single sample. The
total concentration of parathion in the atmosphere was 9.4 ng/m 3 . Of this,
78% (7.3 ng/m 3 ) was in the vapor phase. Only 10% (0.9 ng/m 3 ) was dissolved
in the fog droplet, even though the concentration in the droplet was high—
30 µg/L—resulting from the high enrichment factor (Glotfelty et al., 1987)
and low concentration (<0.1 mg/m 3 ) of suspended water droplets in foggy
atmospheres. Up to 11% (1.0 ng/m 3 ) appeared to be attached to aerosol particles. And only 0.6% was attached to solids flterable from the fogwater. It
was not determined whether the particulate-bound pesticides were present
adsorbed to particles before the fog formed or were sorbed out from dissolved pesticides present in the droplets after the fog formed.
Pesticides in Fog
TABLE 7.2
Aqueous-Phase Enrichment Factors (K AW / D) for the Distribution of
Pesticides between Fogwater and Air
Compound
1/8–9
1/9
1/11 a
1/12
1/12–13
Mean
Diazinon
6
59
14
50
160
58
Parathion
4
12
5
18
29
14
Chlorpyrifos
7
55
3.5
40
74
42
Methidathion
0.06
3
0.02
1.4
2.3
1.4
Paraoxon
2.1
14
10
48
>69
>19
Source: Reprinted (adapted) with permission from Glotfelty, D.E., Majewski,
M.S., and Seiber, J.N. (1990b). Distribution of several organophosphorus
insecticides and their OAs in a foggy atmosphere. Environ. Sci. Technol.
24, 353–357. Copyright (1990) American Chemical Society.
a Hills Valley Road site.
FIGURE 7.5
Distribution of parathion in the foggy atmosphere near Parlier, CA, on January 12, 1986.
(Reprinted (adapted) with permission from Glotfelty, D.E., Majewski, M.S., and Seiber, J.N.
(1990b). Distribution of several organophosphorus insecticides and their OAs in a foggy atmosphere. Environ. Sci. Technol. 24, 353–357. Copyright (1990) American Chemical Society.)
proportion of all of the compounds, in all of the events, in the interstitial air
phase, either as vapor or adsorbed to aerosol particles.
Figure 7.5 shows this distribution for parathion for a single sample. The
total concentration of parathion in the atmosphere was 9.4 ng/m 3 . Of this,
78% (7.3 ng/m 3 ) was in the vapor phase. Only 10% (0.9 ng/m 3 ) was dissolved
in the fog droplet, even though the concentration in the droplet was high—
30 µg/L—resulting from the high enrichment factor (Glotfelty et al., 1987)
and low concentration (<0.1 mg/m 3 ) of suspended water droplets in foggy
atmospheres. Up to 11% (1.0 ng/m 3 ) appeared to be attached to aerosol particles. And only 0.6% was attached to solids flterable from the fogwater. It
was not determined whether the particulate-bound pesticides were present
adsorbed to particles before the fog formed or were sorbed out from dissolved pesticides present in the droplets after the fog formed.