

7. Pipet 15–15 μl from the last well (which is not diluted) of the
serial dilution to three horizontal wells of the black 384-well
plate, then repeat this procedure with all wells of the serial
dilution. This way, 3 Â 8 (24) wells’ fluorescence is measured
by the plate reader.
8. Analyze the data using Origin software (or other data analyzer
software package) applying a quadratic binding equation (see
Note 5).
3.2.2 Competitive Assay
For a competitive assay, in which the unlabeled RSK fragment
competes with the labeled peptide fragment for the binding site
of the PDZ domain, one should calculate the amount of PDZ
domain added to the labeled peptide, as this time the PDZ domain
is supplemented in the tracer solutions. As a rule of thumb, the
saturation of the binding site of the PDZ domain with the labeled
peptide should be 60–80%. By fixing the concentration of the
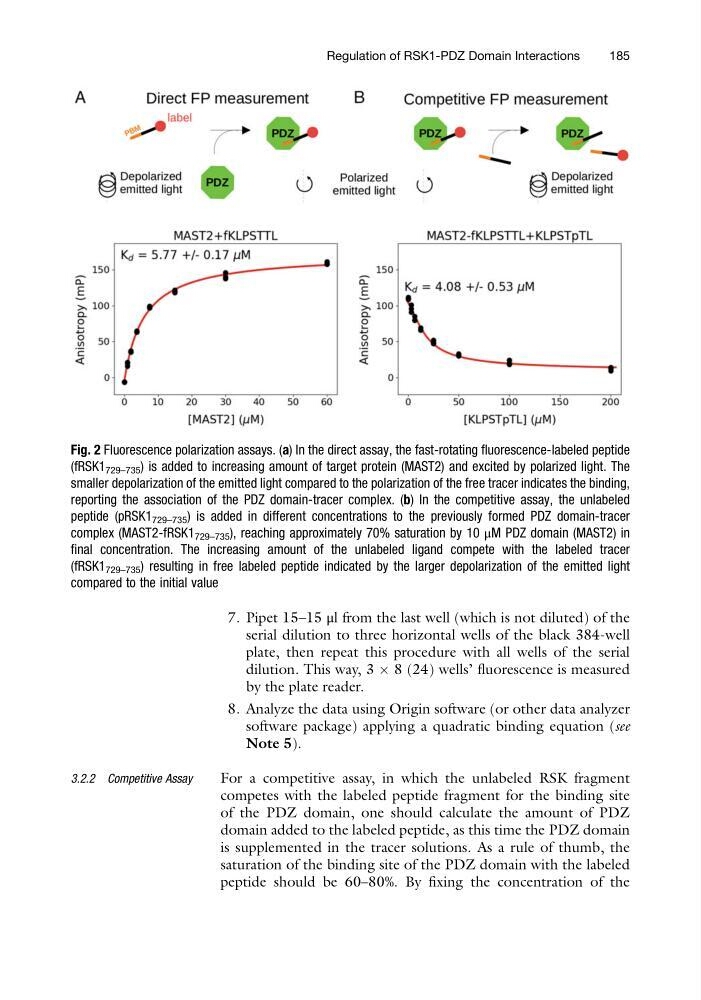
Fig. 2 Fluorescence polarization assays. (a) In the direct assay, the fast-rotating fluorescence-labeled peptide
(fRSK1 729–735 ) is added to increasing amount of target protein (MAST2) and excited by polarized light. The
smaller depolarization of the emitted light compared to the polarization of the free tracer indicates the binding,
reporting the association of the PDZ domain-tracer complex. (b) In the competitive assay, the unlabeled
peptide (pRSK1 729–735 ) is added in different concentrations to the previously formed PDZ domain-tracer
complex (MAST2-fRSK1 729–735 ), reaching approximately 70% saturation by 10 μM PDZ domain (MAST2) in
final concentration. The increasing amount of the unlabeled ligand compete with the labeled tracer
(fRSK1 729–735 ) resulting in free labeled peptide indicated by the larger depolarization of the emitted light
compared to the initial value
Regulation of RSK1-PDZ Domain Interactions
185
serial dilution to three horizontal wells of the black 384-well
plate, then repeat this procedure with all wells of the serial
dilution. This way, 3 Â 8 (24) wells’ fluorescence is measured
by the plate reader.
8. Analyze the data using Origin software (or other data analyzer
software package) applying a quadratic binding equation (see
Note 5).
3.2.2 Competitive Assay
For a competitive assay, in which the unlabeled RSK fragment
competes with the labeled peptide fragment for the binding site
of the PDZ domain, one should calculate the amount of PDZ
domain added to the labeled peptide, as this time the PDZ domain
is supplemented in the tracer solutions. As a rule of thumb, the
saturation of the binding site of the PDZ domain with the labeled
peptide should be 60–80%. By fixing the concentration of the
Fig. 2 Fluorescence polarization assays. (a) In the direct assay, the fast-rotating fluorescence-labeled peptide
(fRSK1 729–735 ) is added to increasing amount of target protein (MAST2) and excited by polarized light. The
smaller depolarization of the emitted light compared to the polarization of the free tracer indicates the binding,
reporting the association of the PDZ domain-tracer complex. (b) In the competitive assay, the unlabeled
peptide (pRSK1 729–735 ) is added in different concentrations to the previously formed PDZ domain-tracer
complex (MAST2-fRSK1 729–735 ), reaching approximately 70% saturation by 10 μM PDZ domain (MAST2) in
final concentration. The increasing amount of the unlabeled ligand compete with the labeled tracer
(fRSK1 729–735 ) resulting in free labeled peptide indicated by the larger depolarization of the emitted light
compared to the initial value
Regulation of RSK1-PDZ Domain Interactions
185