

and 320 nm, it can be attributed to the scattering of light by large
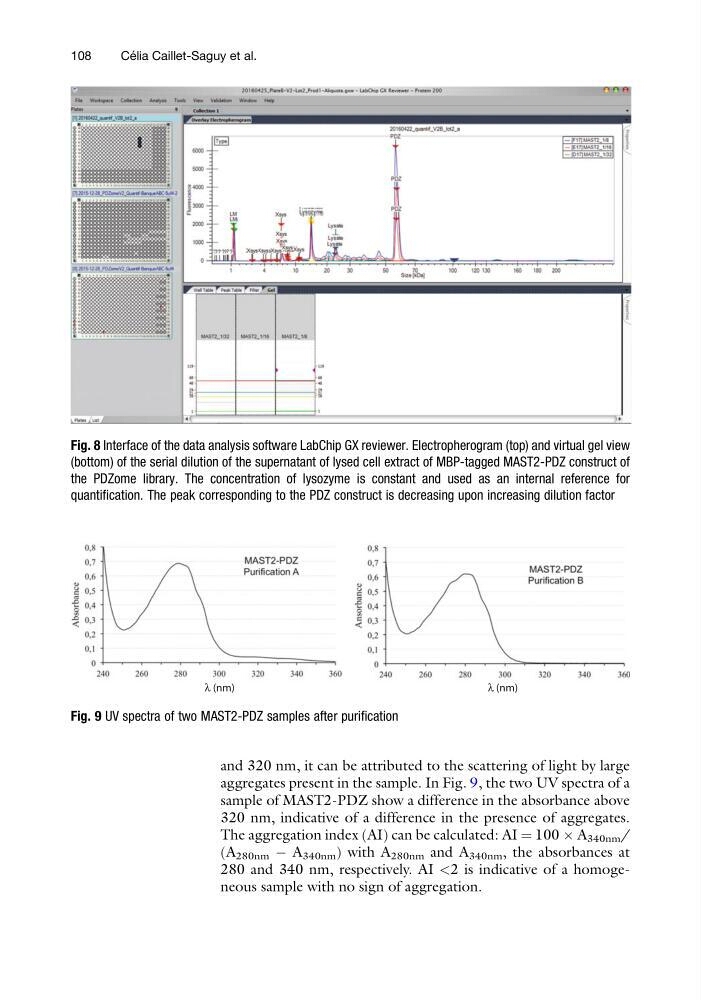
aggregates present in the sample. In Fig. 9, the two UV spectra of a
sample of MAST2-PDZ show a difference in the absorbance above
320 nm, indicative of a difference in the presence of aggregates.
The aggregation index (AI) can be calculated: AI ¼ 100 Â A 340nm /
(A 280nm À A 340nm ) with A 280nm and A 340nm , the absorbances at
280 and 340 nm, respectively. AI <2 is indicative of a homogeneous sample with no sign of aggregation.
Fig. 8 Interface of the data analysis software LabChip GX reviewer. Electropherogram (top) and virtual gel view
(bottom) of the serial dilution of the supernatant of lysed cell extract of MBP-tagged MAST2-PDZ construct of
the PDZome library. The concentration of lysozyme is constant and used as an internal reference for
quantification. The peak corresponding to the PDZ construct is decreasing upon increasing dilution factor
λ (nm)
λ (nm)
Fig. 9 UV spectra of two MAST2-PDZ samples after purification
108
Ce ´ lia Caillet-Saguy et al.
aggregates present in the sample. In Fig. 9, the two UV spectra of a
sample of MAST2-PDZ show a difference in the absorbance above
320 nm, indicative of a difference in the presence of aggregates.
The aggregation index (AI) can be calculated: AI ¼ 100 Â A 340nm /
(A 280nm À A 340nm ) with A 280nm and A 340nm , the absorbances at
280 and 340 nm, respectively. AI <2 is indicative of a homogeneous sample with no sign of aggregation.
Fig. 8 Interface of the data analysis software LabChip GX reviewer. Electropherogram (top) and virtual gel view
(bottom) of the serial dilution of the supernatant of lysed cell extract of MBP-tagged MAST2-PDZ construct of
the PDZome library. The concentration of lysozyme is constant and used as an internal reference for
quantification. The peak corresponding to the PDZ construct is decreasing upon increasing dilution factor
λ (nm)
λ (nm)
Fig. 9 UV spectra of two MAST2-PDZ samples after purification
108
Ce ´ lia Caillet-Saguy et al.