

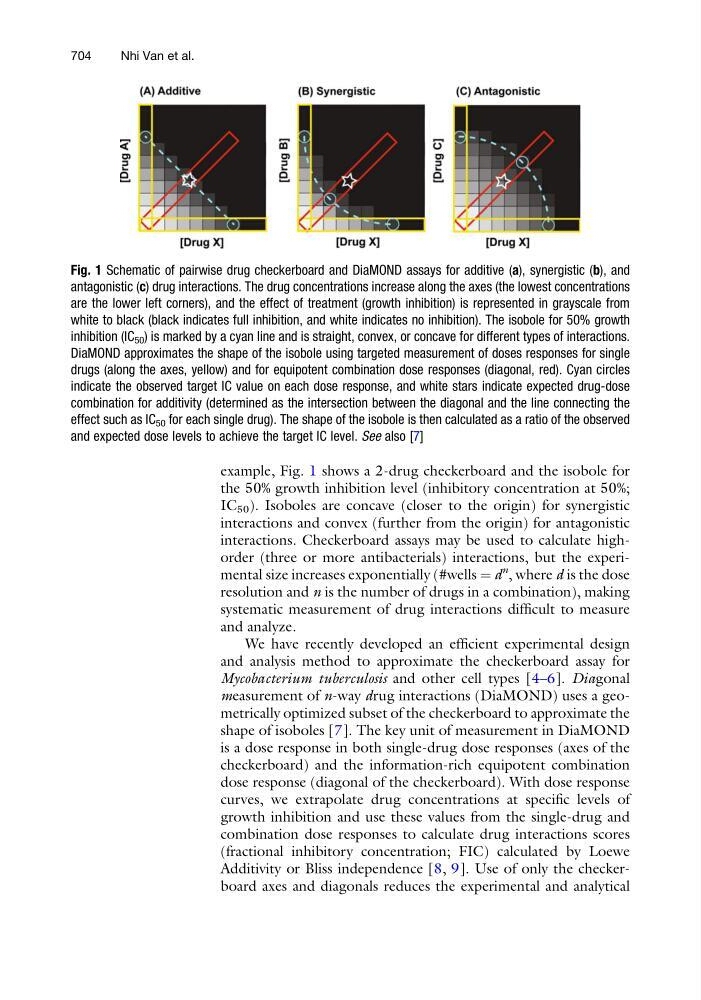
example, Fig. 1 shows a 2-drug checkerboard and the isobole for
the 50% growth inhibition level (inhibitory concentration at 50%;
IC 50 ). Isoboles are concave (closer to the origin) for synergistic
interactions and convex (further from the origin) for antagonistic
interactions. Checkerboard assays may be used to calculate highorder (three or more antibacterials) interactions, but the experimental size increases exponentially (#wells ¼ d
n
, where d is the dose
resolution and n is the number of drugs in a combination), making
systematic measurement of drug interactions difficult to measure
and analyze.
We have recently developed an efficient experimental design
and analysis method to approximate the checkerboard assay for
Mycobacterium tuberculosis and other cell types [4–6]. Diagonal
measurement of n-way drug interactions (DiaMOND) uses a geometrically optimized subset of the checkerboard to approximate the
shape of isoboles [7]. The key unit of measurement in DiaMOND
is a dose response in both single-drug dose responses (axes of the
checkerboard) and the information-rich equipotent combination
dose response (diagonal of the checkerboard). With dose response
curves, we extrapolate drug concentrations at specific levels of
growth inhibition and use these values from the single-drug and
combination dose responses to calculate drug interactions scores
(fractional inhibitory concentration; FIC) calculated by Loewe
Additivity or Bliss independence [8, 9]. Use of only the checkerboard axes and diagonals reduces the experimental and analytical
Fig. 1 Schematic of pairwise drug checkerboard and DiaMOND assays for additive (a), synergistic (b), and
antagonistic (c) drug interactions. The drug concentrations increase along the axes (the lowest concentrations
are the lower left corners), and the effect of treatment (growth inhibition) is represented in grayscale from
white to black (black indicates full inhibition, and white indicates no inhibition). The isobole for 50% growth
inhibition (IC 50 ) is marked by a cyan line and is straight, convex, or concave for different types of interactions.
DiaMOND approximates the shape of the isobole using targeted measurement of doses responses for single
drugs (along the axes, yellow) and for equipotent combination dose responses (diagonal, red). Cyan circles
indicate the observed target IC value on each dose response, and white stars indicate expected drug-dose
combination for additivity (determined as the intersection between the diagonal and the line connecting the
effect such as IC 50 for each single drug). The shape of the isobole is then calculated as a ratio of the observed
and expected dose levels to achieve the target IC level. See also [7]
704
Nhi Van et al.