

Table 2
Excitation and emission wavelength for common fluorophores
Fluorophore
Excitation (nm)
Emission (nm)
DAPI
405
450
Hoechst 33342
405
450
HCS CellMask Blue Stain
405
450
CCF4-AM
405
450–540
GFP
488
540
LysoTracker Green DND-26 dye
488
540
CellROX
® Green Oxidative Stress Reagent
488
540
FluoZin™-3, AM, cell permeant
488
540
HCS LipidTox Green Neutral Lipid Stain
488
540
RFP
561
600
LysoTracker Red DND-99 dye
561
600
pHrodo™ Red succinimidyl (NHS) Ester
561
600
SYTO 60 Red Fluorescent Nucleic Acid Stain
640
690
HCS CellMask Deep Red Plasma Membrane Stain
640
690
Alexa Fluor 660 Phalloidin Stain
640
690
CellROX
® Deep Red Oxidative Stress Reagent
640
690
ROS-ID
® Red NO Detection Reagent
640
690
HCS LipidTox Far Red Neutral Lipid Stain
640
690
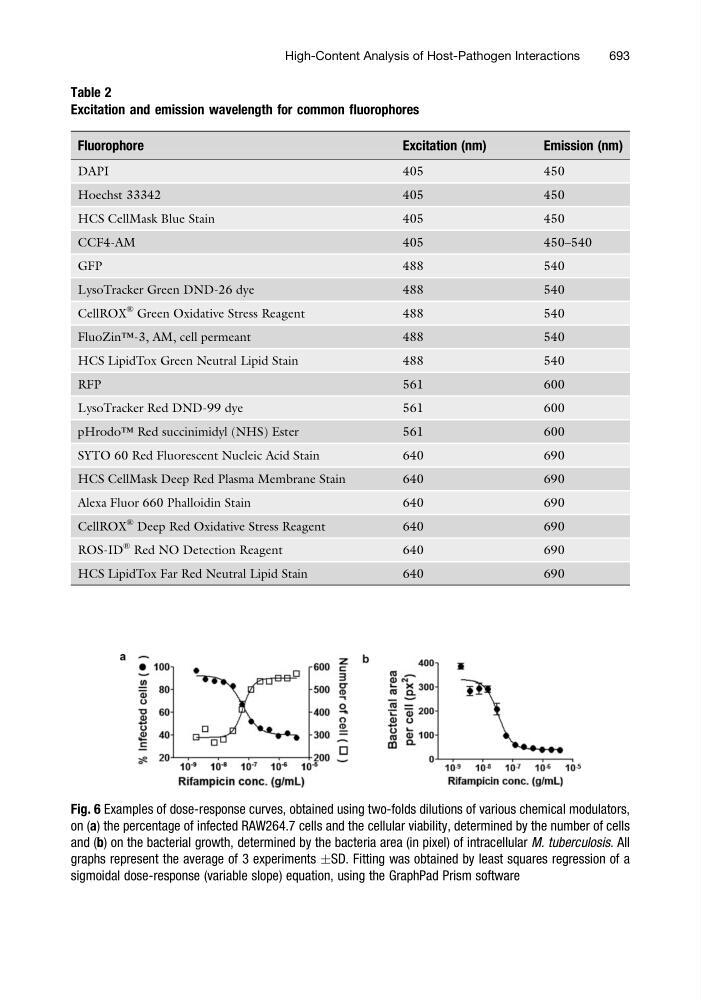
Fig. 6 Examples of dose-response curves, obtained using two-folds dilutions of various chemical modulators,
on (a) the percentage of infected RAW264.7 cells and the cellular viability, determined by the number of cells
and (b) on the bacterial growth, determined by the bacteria area (in pixel) of intracellular M. tuberculosis. All
graphs represent the average of 3 experiments ÆSD. Fitting was obtained by least squares regression of a
sigmoidal dose-response (variable slope) equation, using the GraphPad Prism software
High-Content Analysis of Host-Pathogen Interactions
693