

[14–17] or in a cluster of samples from an epidemiologic investigation [18, 19]. The comparison of the relative abundance of proteins
among sample sets requires data quality analyses to account for
instrumentation variability over injection cycles, which may impact
elution times and number of spectra/injection, and sample preparation and processing, which may result in changes in peak area/
peptides and missing peptides due to transient ion suppression,
among other confounders. Several software solutions exist to assist
the researcher with performing quality control analyses prior to
comparing samples for proteomics [20–24]. In addition, best practices, including digest standards between sample injections and the
use of internal standards, are recommended (see Ref. 25 for example). The analysis of data acquired by top-down proteomics faces a
particular challenge due to complex deconvolution required to
identify the multiple proteoforms for a single protein. Multiple
freely accessible top-down proteomics tools can be found here:
http://nrtdp.northwestern.edu/resource-software/ to assist with
analyses of resultant spectra from top-down proteomics
experiments.
Finally, publication of proteomics experiments in the majority
of peer review journals requires the data and associated metadata to
be deposited in a public repository, so that the data are accessible
both during the review process and after the manuscript has been
published. For a list of available proteomics resources and repositories, refer to the reviews by Riffle & Eng and Perez-Riverol
[26, 27].
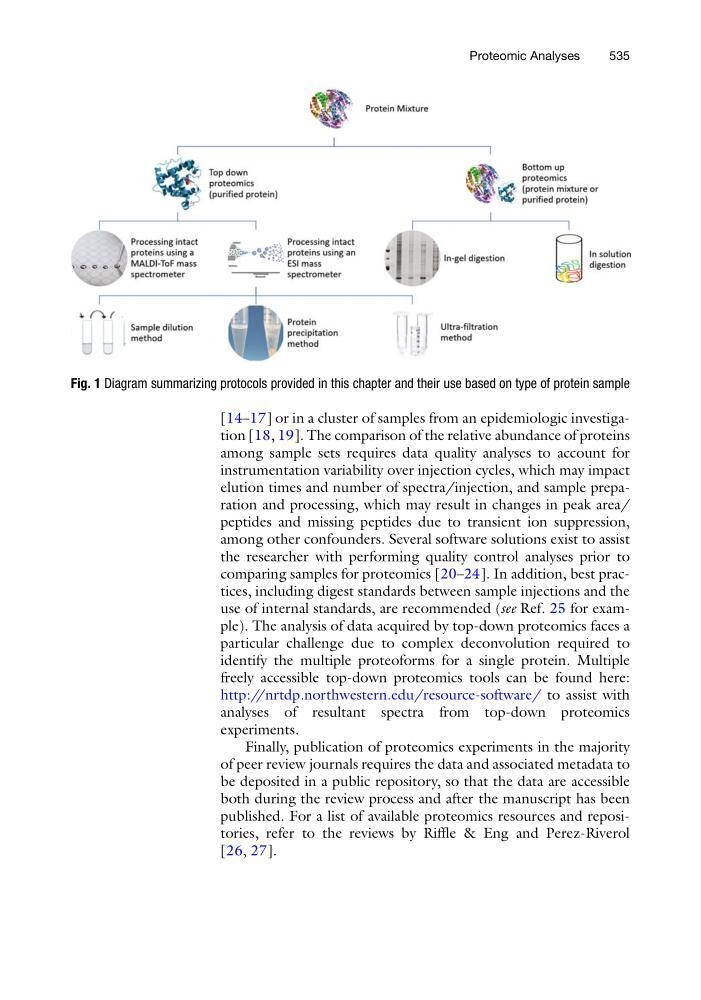
Fig. 1 Diagram summarizing protocols provided in this chapter and their use based on type of protein sample
Proteomic Analyses
535
among sample sets requires data quality analyses to account for
instrumentation variability over injection cycles, which may impact
elution times and number of spectra/injection, and sample preparation and processing, which may result in changes in peak area/
peptides and missing peptides due to transient ion suppression,
among other confounders. Several software solutions exist to assist
the researcher with performing quality control analyses prior to
comparing samples for proteomics [20–24]. In addition, best practices, including digest standards between sample injections and the
use of internal standards, are recommended (see Ref. 25 for example). The analysis of data acquired by top-down proteomics faces a
particular challenge due to complex deconvolution required to
identify the multiple proteoforms for a single protein. Multiple
freely accessible top-down proteomics tools can be found here:
http://nrtdp.northwestern.edu/resource-software/ to assist with
analyses of resultant spectra from top-down proteomics
experiments.
Finally, publication of proteomics experiments in the majority
of peer review journals requires the data and associated metadata to
be deposited in a public repository, so that the data are accessible
both during the review process and after the manuscript has been
published. For a list of available proteomics resources and repositories, refer to the reviews by Riffle & Eng and Perez-Riverol
[26, 27].
Fig. 1 Diagram summarizing protocols provided in this chapter and their use based on type of protein sample
Proteomic Analyses
535