

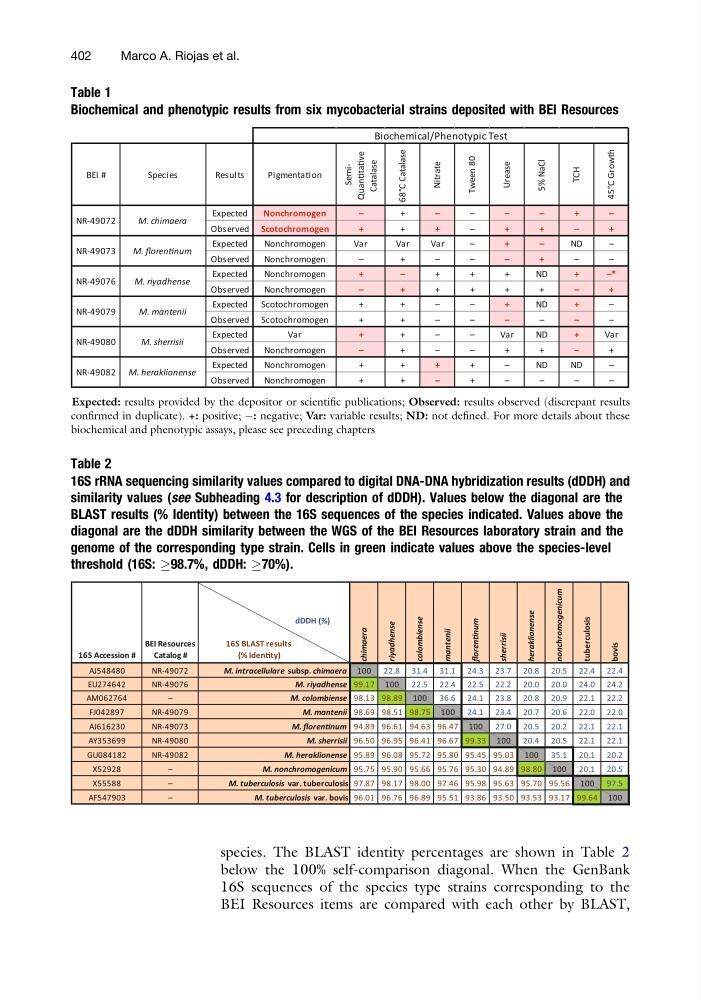
species. The BLAST identity percentages are shown in Table 2
below the 100% self-comparison diagonal. When the GenBank
16S sequences of the species type strains corresponding to the
BEI Resources items are compared with each other by BLAST,
Table 1
Biochemical and phenotypic results from six mycobacterial strains deposited with BEI Resources
BEI #
Species
Results
PigmentaƟon
SemiQuanƟtaƟve
Catalase
68°C Catalase
Nitrate
Tween 80
Urease
5% NaCl
TCH
45°C Growth
Expected
Nonchromogen
–
+
–
–
–
–
+
–
Observed Scotochromogen
+
+
+
–
+
+
–
+
Expected
Nonchromogen
Var
Var
Var
–
+
–
ND
–
Observed
Nonchromogen
–
+
–
–
–
+
–
–
Expected
Nonchromogen
+
–
+
+
+
N D
+
– *
Observed
Nonchromogen
–
+
+
+
+
+
–
+
Expected Scotochromogen
+
+
–
–
+
ND
+
–
Observed Scotochromogen
+
+
–
–
–
–
–
–
Expected
Var
+
+
–
–
V a r
N D
+
Var
Observed
Nonchromogen
–
+
–
–
+
+
–
+
Expected
Nonchromogen
+
+
+
+
–
ND
ND
–
Observed
Nonchromogen
+
+
–
+
–
–
–
–
Biochemical/Phenotypic Test
M. chimaera
M. florenƟnum
M. riyadhense
M. mantenii
M. sherrisii
M. heraklionense
NR-49072
NR-49073
NR-49076
NR-49079
NR-49080
NR-49082
Expected: results provided by the depositor or scientific publications; Observed: results observed (discrepant results
confirmed in duplicate). +: positive; À: negative; Var: variable results; ND: not defined. For more details about these
biochemical and phenotypic assays, please see preceding chapters
Table 2
16S rRNA sequencing similarity values compared to digital DNA-DNA hybridization results (dDDH) and
similarity values (see Subheading 4.3 for description of dDDH). Values below the diagonal are the
BLAST results (% Identity) between the 16S sequences of the species indicated. Values above the
diagonal are the dDDH similarity between the WGS of the BEI Resources laboratory strain and the
genome of the corresponding type strain. Cells in green indicate values above the species-level
threshold (16S: !98.7%, dDDH: !70%).
16S Accession #
BEI Resources
Catalog #
dDDH (%)
.
16S BLAST results
.
(% IdenƟty)
.
chimaera
riyadhense
colombiense
mantenii
florenƟnum
sherrisii
heraklionense
nonchromogenicum
tuberculosis
bovis
AJ548480
NR-49072
M. intracellulare subsp. chimaera 100 22.8 31.4 31.1 24.3 23.7 20.8 20.5 22.4 22.4
EU274642
NR-49076
M. riyadhense 99.17 100 22.5 22.4 22.5 22.2 20.0 20.0 24.0 24.2
AM062764
–
M. colombiense 98.13 98.89 100 36.6 24.1 23.8 20.8 20.9 22.1 22.2
FJ042897
NR-49079
M. mantenii 98.69 98.51 98.75 100 24.1 23.4 20.7 20.6 22.0 22.0
AJ616230
NR-49073
M. florenƟnum 94.89 96.61 94.63 96.47 100 27.0 20.5 20.2 22.1 22.1
AY353699
NR-49080
M. sherrisii 96.50 96.95 96.41 96.67 99.33 100 20.4 20.5 22.1 22.1
GU084182
NR-49082
M. heraklionense 95.89 96.08 95.72 95.80 95.45 95.03 100 35.1 20.1 20.2
X52928
–
M. nonchromogenicum 95.75 95.90 95.66 95.76 95.30 94.89 98.80 100 20.1 20.5
X55588
–
M. tuberculosis var. tuberculosis 97.87 98.17 98.00 97.46 95.98 95.63 95.70 95.56 100 97.5
AF547903
–
M. tuberculosis var. bovis 96.01 96.76 96.89 95.51 93.86 93.50 93.53 93.17 99.64 100
402
Marco A. Riojas et al.
below the 100% self-comparison diagonal. When the GenBank
16S sequences of the species type strains corresponding to the
BEI Resources items are compared with each other by BLAST,
Table 1
Biochemical and phenotypic results from six mycobacterial strains deposited with BEI Resources
BEI #
Species
Results
PigmentaƟon
SemiQuanƟtaƟve
Catalase
68°C Catalase
Nitrate
Tween 80
Urease
5% NaCl
TCH
45°C Growth
Expected
Nonchromogen
–
+
–
–
–
–
+
–
Observed Scotochromogen
+
+
+
–
+
+
–
+
Expected
Nonchromogen
Var
Var
Var
–
+
–
ND
–
Observed
Nonchromogen
–
+
–
–
–
+
–
–
Expected
Nonchromogen
+
–
+
+
+
N D
+
– *
Observed
Nonchromogen
–
+
+
+
+
+
–
+
Expected Scotochromogen
+
+
–
–
+
ND
+
–
Observed Scotochromogen
+
+
–
–
–
–
–
–
Expected
Var
+
+
–
–
V a r
N D
+
Var
Observed
Nonchromogen
–
+
–
–
+
+
–
+
Expected
Nonchromogen
+
+
+
+
–
ND
ND
–
Observed
Nonchromogen
+
+
–
+
–
–
–
–
Biochemical/Phenotypic Test
M. chimaera
M. florenƟnum
M. riyadhense
M. mantenii
M. sherrisii
M. heraklionense
NR-49072
NR-49073
NR-49076
NR-49079
NR-49080
NR-49082
Expected: results provided by the depositor or scientific publications; Observed: results observed (discrepant results
confirmed in duplicate). +: positive; À: negative; Var: variable results; ND: not defined. For more details about these
biochemical and phenotypic assays, please see preceding chapters
Table 2
16S rRNA sequencing similarity values compared to digital DNA-DNA hybridization results (dDDH) and
similarity values (see Subheading 4.3 for description of dDDH). Values below the diagonal are the
BLAST results (% Identity) between the 16S sequences of the species indicated. Values above the
diagonal are the dDDH similarity between the WGS of the BEI Resources laboratory strain and the
genome of the corresponding type strain. Cells in green indicate values above the species-level
threshold (16S: !98.7%, dDDH: !70%).
16S Accession #
BEI Resources
Catalog #
dDDH (%)
.
16S BLAST results
.
(% IdenƟty)
.
chimaera
riyadhense
colombiense
mantenii
florenƟnum
sherrisii
heraklionense
nonchromogenicum
tuberculosis
bovis
AJ548480
NR-49072
M. intracellulare subsp. chimaera 100 22.8 31.4 31.1 24.3 23.7 20.8 20.5 22.4 22.4
EU274642
NR-49076
M. riyadhense 99.17 100 22.5 22.4 22.5 22.2 20.0 20.0 24.0 24.2
AM062764
–
M. colombiense 98.13 98.89 100 36.6 24.1 23.8 20.8 20.9 22.1 22.2
FJ042897
NR-49079
M. mantenii 98.69 98.51 98.75 100 24.1 23.4 20.7 20.6 22.0 22.0
AJ616230
NR-49073
M. florenƟnum 94.89 96.61 94.63 96.47 100 27.0 20.5 20.2 22.1 22.1
AY353699
NR-49080
M. sherrisii 96.50 96.95 96.41 96.67 99.33 100 20.4 20.5 22.1 22.1
GU084182
NR-49082
M. heraklionense 95.89 96.08 95.72 95.80 95.45 95.03 100 35.1 20.1 20.2
X52928
–
M. nonchromogenicum 95.75 95.90 95.66 95.76 95.30 94.89 98.80 100 20.1 20.5
X55588
–
M. tuberculosis var. tuberculosis 97.87 98.17 98.00 97.46 95.98 95.63 95.70 95.56 100 97.5
AF547903
–
M. tuberculosis var. bovis 96.01 96.76 96.89 95.51 93.86 93.50 93.53 93.17 99.64 100
402
Marco A. Riojas et al.