

Macrophages
98.7
Single Cells
99.6
Ungated
Gated on Macrophages
(A)
(B)
SSC-A
FSC-A
FSC-H
FSC-A
Live
90.0
Bystander
42.9
Infected
55.4
0
Gated on Macrophages + Single Cells
Gated on Live, Single Macrophages
LiveDead-NearIR-A
GFP-Mtb-A
SSC-A
SSC-A
(C)
(D)
(E)
Normalized to Mode
HLA-DR-APC
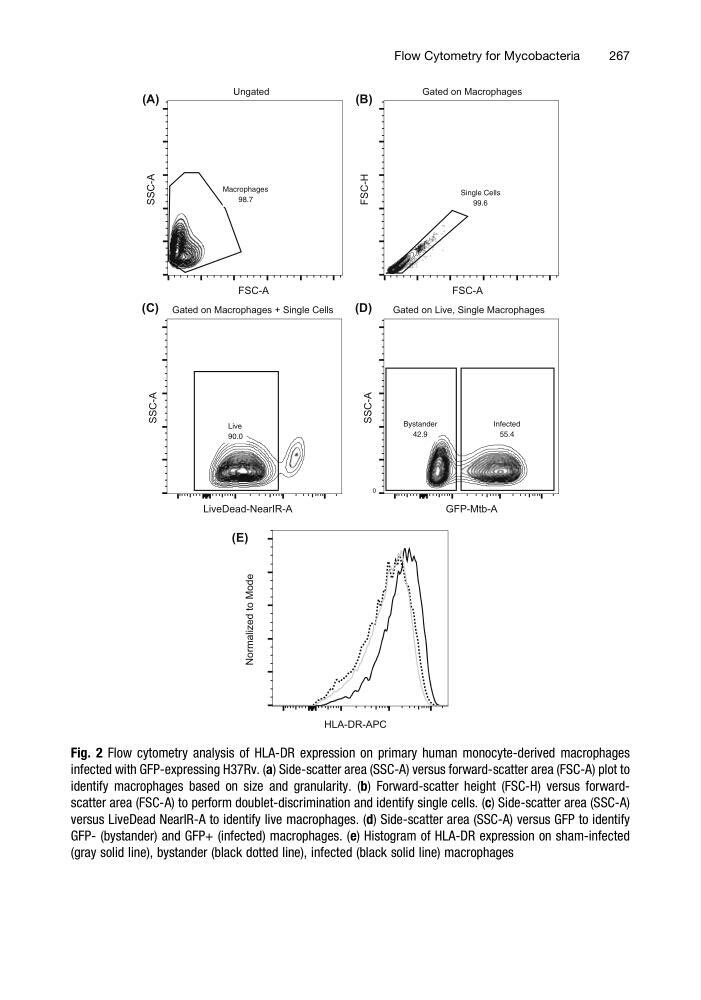
Fig. 2 Flow cytometry analysis of HLA-DR expression on primary human monocyte-derived macrophages
infected with GFP-expressing H37Rv. (a) Side-scatter area (SSC-A) versus forward-scatter area (FSC-A) plot to
identify macrophages based on size and granularity. (b) Forward-scatter height (FSC-H) versus forwardscatter area (FSC-A) to perform doublet-discrimination and identify single cells. (c) Side-scatter area (SSC-A)
versus LiveDead NearIR-A to identify live macrophages. (d) Side-scatter area (SSC-A) versus GFP to identify
GFP- (bystander) and GFP+ (infected) macrophages. (e) Histogram of HLA-DR expression on sham-infected
(gray solid line), bystander (black dotted line), infected (black solid line) macrophages
Flow Cytometry for Mycobacteria
267
98.7
Single Cells
99.6
Ungated
Gated on Macrophages
(A)
(B)
SSC-A
FSC-A
FSC-H
FSC-A
Live
90.0
Bystander
42.9
Infected
55.4
0
Gated on Macrophages + Single Cells
Gated on Live, Single Macrophages
LiveDead-NearIR-A
GFP-Mtb-A
SSC-A
SSC-A
(C)
(D)
(E)
Normalized to Mode
HLA-DR-APC
Fig. 2 Flow cytometry analysis of HLA-DR expression on primary human monocyte-derived macrophages
infected with GFP-expressing H37Rv. (a) Side-scatter area (SSC-A) versus forward-scatter area (FSC-A) plot to
identify macrophages based on size and granularity. (b) Forward-scatter height (FSC-H) versus forwardscatter area (FSC-A) to perform doublet-discrimination and identify single cells. (c) Side-scatter area (SSC-A)
versus LiveDead NearIR-A to identify live macrophages. (d) Side-scatter area (SSC-A) versus GFP to identify
GFP- (bystander) and GFP+ (infected) macrophages. (e) Histogram of HLA-DR expression on sham-infected
(gray solid line), bystander (black dotted line), infected (black solid line) macrophages
Flow Cytometry for Mycobacteria
267