

34). Polychroic 2 (D-F-mCh-C): DAPI (Ex:390/18–
Em:435/48);
FITC
(Ex:475/28–Em:525/48);
mCherry (Ex:575/25–Em:625/45); Cy5 (Ex:632/22–
Em:679/34). Polychroic 3 (C-Y-mCh): CFP (Ex:438/
24–Em:475/24);
YFP
(Ex:513/17–Em:548/22);
mCherry (Ex:575/25–Em:625/45).
(b) Imaging frequency: This again depends on the time scales
of the dynamic process being studied and must balance
the frequency of observation against the risk of toxicity
due to the exposure of cells to fluorescent light. Typically,
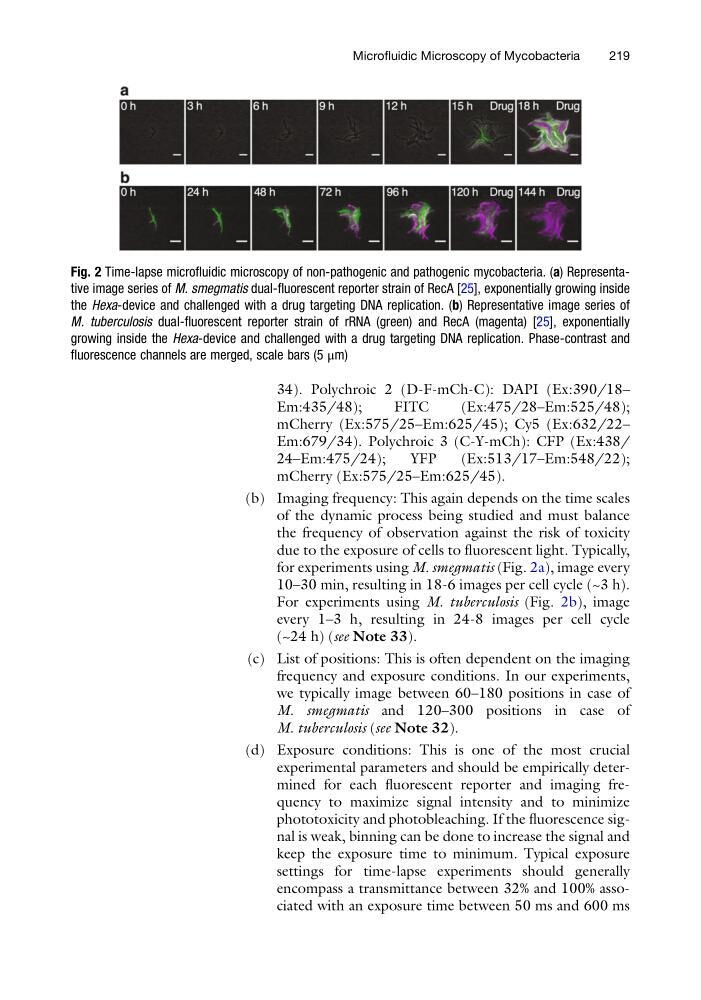
for experiments using M. smegmatis (Fig. 2a), image every
10–30 min, resulting in 18-6 images per cell cycle (~3 h).
For experiments using M. tuberculosis (Fig. 2b), image
every 1–3 h, resulting in 24-8 images per cell cycle
(~24 h) (see Note 33).
(c) List of positions: This is often dependent on the imaging
frequency and exposure conditions. In our experiments,
we typically image between 60–180 positions in case of
M. smegmatis and 120–300 positions in case of
M. tuberculosis (see Note 32).
(d) Exposure conditions: This is one of the most crucial
experimental parameters and should be empirically determined for each fluorescent reporter and imaging frequency to maximize signal intensity and to minimize
phototoxicity and photobleaching. If the fluorescence signal is weak, binning can be done to increase the signal and
keep the exposure time to minimum. Typical exposure
settings for time-lapse experiments should generally
encompass a transmittance between 32% and 100% associated with an exposure time between 50 ms and 600 ms
Fig. 2 Time-lapse microfluidic microscopy of non-pathogenic and pathogenic mycobacteria. (a) Representative image series of M. smegmatis dual-fluorescent reporter strain of RecA [25], exponentially growing inside
the Hexa-device and challenged with a drug targeting DNA replication. (b) Representative image series of
M. tuberculosis dual-fluorescent reporter strain of rRNA (green) and RecA (magenta) [25], exponentially
growing inside the Hexa-device and challenged with a drug targeting DNA replication. Phase-contrast and
fluorescence channels are merged, scale bars (5 μm)
Microfluidic Microscopy of Mycobacteria
219
Em:435/48);
FITC
(Ex:475/28–Em:525/48);
mCherry (Ex:575/25–Em:625/45); Cy5 (Ex:632/22–
Em:679/34). Polychroic 3 (C-Y-mCh): CFP (Ex:438/
24–Em:475/24);
YFP
(Ex:513/17–Em:548/22);
mCherry (Ex:575/25–Em:625/45).
(b) Imaging frequency: This again depends on the time scales
of the dynamic process being studied and must balance
the frequency of observation against the risk of toxicity
due to the exposure of cells to fluorescent light. Typically,
for experiments using M. smegmatis (Fig. 2a), image every
10–30 min, resulting in 18-6 images per cell cycle (~3 h).
For experiments using M. tuberculosis (Fig. 2b), image
every 1–3 h, resulting in 24-8 images per cell cycle
(~24 h) (see Note 33).
(c) List of positions: This is often dependent on the imaging
frequency and exposure conditions. In our experiments,
we typically image between 60–180 positions in case of
M. smegmatis and 120–300 positions in case of
M. tuberculosis (see Note 32).
(d) Exposure conditions: This is one of the most crucial
experimental parameters and should be empirically determined for each fluorescent reporter and imaging frequency to maximize signal intensity and to minimize
phototoxicity and photobleaching. If the fluorescence signal is weak, binning can be done to increase the signal and
keep the exposure time to minimum. Typical exposure
settings for time-lapse experiments should generally
encompass a transmittance between 32% and 100% associated with an exposure time between 50 ms and 600 ms
Fig. 2 Time-lapse microfluidic microscopy of non-pathogenic and pathogenic mycobacteria. (a) Representative image series of M. smegmatis dual-fluorescent reporter strain of RecA [25], exponentially growing inside
the Hexa-device and challenged with a drug targeting DNA replication. (b) Representative image series of
M. tuberculosis dual-fluorescent reporter strain of rRNA (green) and RecA (magenta) [25], exponentially
growing inside the Hexa-device and challenged with a drug targeting DNA replication. Phase-contrast and
fluorescence channels are merged, scale bars (5 μm)
Microfluidic Microscopy of Mycobacteria
219