

3.10 Data Analysis
for Developmental
Cycle Experiments
1. Analyze data from Subheading 3.7. Use a background subtraction to compensate for artefacts generated by stitching the
frames into a single field of view and ensure no other fluorescent artefacts compromise the image (see Note 18).
2. Perform a colocalization analysis by using an appropriate software. In this chapter, a region of interest (ROI) was defined
with ImageJ and analyzed with Van Steensel’s approach as
implemented in the ImageJ Plug-in JACoP (see Note 19).
4 Notes
1. Autoclaved media show high autofluorescence, most certainly
due to Maillard chemical reactions between amino acids and
reducing sugars that increase with temperature. Filter-sterilized
medium is more appropriate for fluorescence microscopy
experiments.
2. M. marinum is a fish and frog pathogen, thanks to its growth
restriction above 32
C, it cannot cause systemic infection in
humans. However, special handling and laboratory equipment
are necessary (gloves, lab coat, blunt needles, etc.) because it
may produce skin lesions and granuloma in the extremities. It is
5
10
15
20
25
30
35
40
45
50
55
0
2
4
6
8
10
Intracellular M. marinum growth
using HC screen
Time (Hours)
Relative fold change (RFU)
WT no cmpd
WT + Rifabutin 10 PM
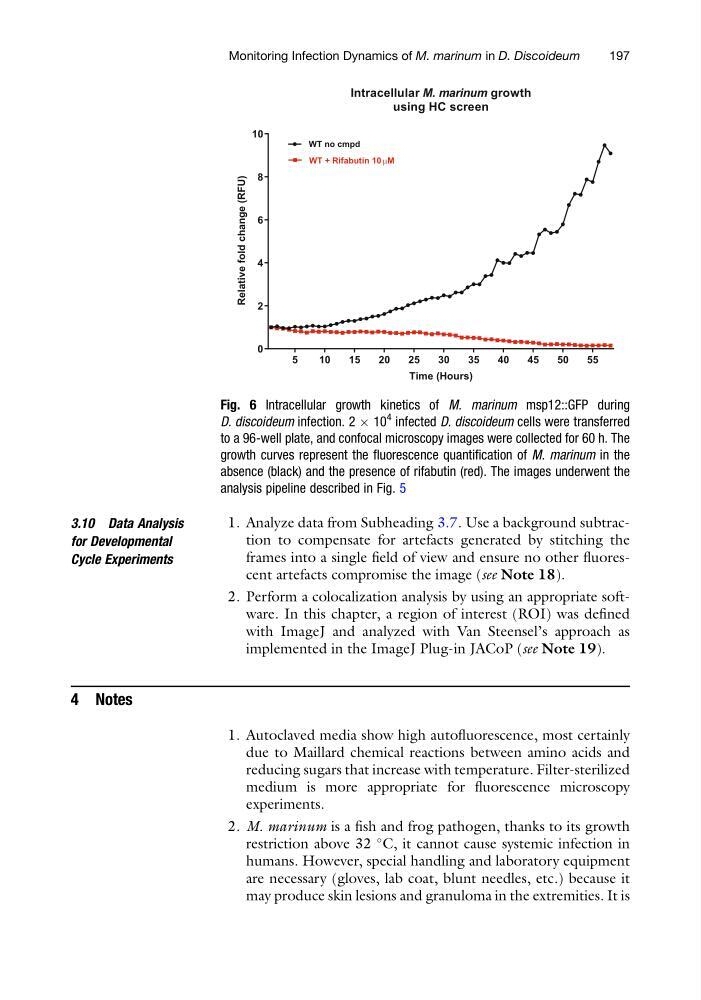
Fig. 6 Intracellular growth kinetics of M. marinum msp12::GFP during
D. discoideum infection. 2 Â 10
4
infected D. discoideum cells were transferred
to a 96-well plate, and confocal microscopy images were collected for 60 h. The
growth curves represent the fluorescence quantification of M. marinum in the
absence (black) and the presence of rifabutin (red). The images underwent the
analysis pipeline described in Fig. 5
Monitoring Infection Dynamics of M. marinum in D. Discoideum
197
for Developmental
Cycle Experiments
1. Analyze data from Subheading 3.7. Use a background subtraction to compensate for artefacts generated by stitching the
frames into a single field of view and ensure no other fluorescent artefacts compromise the image (see Note 18).
2. Perform a colocalization analysis by using an appropriate software. In this chapter, a region of interest (ROI) was defined
with ImageJ and analyzed with Van Steensel’s approach as
implemented in the ImageJ Plug-in JACoP (see Note 19).
4 Notes
1. Autoclaved media show high autofluorescence, most certainly
due to Maillard chemical reactions between amino acids and
reducing sugars that increase with temperature. Filter-sterilized
medium is more appropriate for fluorescence microscopy
experiments.
2. M. marinum is a fish and frog pathogen, thanks to its growth
restriction above 32
C, it cannot cause systemic infection in
humans. However, special handling and laboratory equipment
are necessary (gloves, lab coat, blunt needles, etc.) because it
may produce skin lesions and granuloma in the extremities. It is
5
10
15
20
25
30
35
40
45
50
55
0
2
4
6
8
10
Intracellular M. marinum growth
using HC screen
Time (Hours)
Relative fold change (RFU)
WT no cmpd
WT + Rifabutin 10 PM
Fig. 6 Intracellular growth kinetics of M. marinum msp12::GFP during
D. discoideum infection. 2 Â 10
4
infected D. discoideum cells were transferred
to a 96-well plate, and confocal microscopy images were collected for 60 h. The
growth curves represent the fluorescence quantification of M. marinum in the
absence (black) and the presence of rifabutin (red). The images underwent the
analysis pipeline described in Fig. 5
Monitoring Infection Dynamics of M. marinum in D. Discoideum
197