

16e
16
17B
17
18e
18
19B
20
M 24 M 26 M 29 M 32
P 25
P 27 26
22 24
28
14
16
18
18e
19B
22
24
GC
MS
Molecular weight
M detected
RT order
Characteristic peak
M methyl ester
m/z
14:0
74
256
M or M-32
16:1
55
268
M
16:0
74
270
M or M-32
17B
74
284
M
(a) 2-octadecanol #
45
270
M-18
18:1
55
296
M
18:0
74
298
M and M-32
19B
74
312
M
(b) 2-eicosanol #
45
298
M-18
20:0
74
326
M or M-32
22:0
74
354
M or M-32
M24:0
88
382
M
P25:1*
127 and 169
394
M
24:0
74
382
M or M-32
M26
88
410
M
P27:1*
127 and 169
422
M
26:0
74
410
M or M-32
M29
88
452
M
M32
88
494
M
14
16e
a
b
20
22
26
100°
160°
210°
270°C
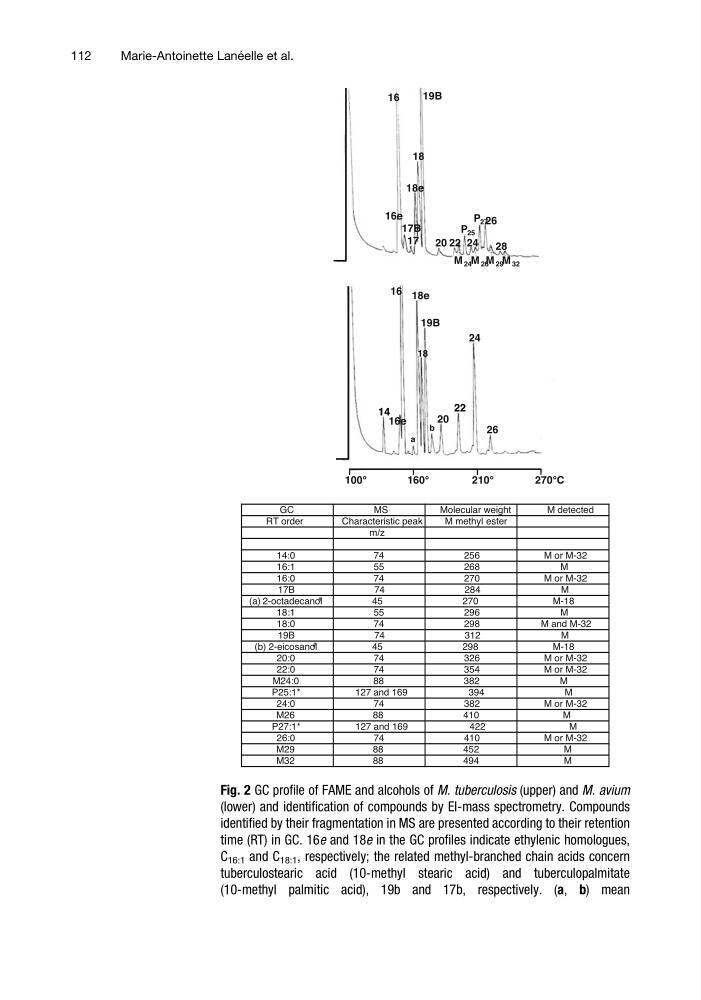
Fig. 2 GC profile of FAME and alcohols of M. tuberculosis (upper) and M. avium
(lower) and identification of compounds by EI-mass spectrometry. Compounds
identified by their fragmentation in MS are presented according to their retention
time (RT) in GC. 16e and 18e in the GC profiles indicate ethylenic homologues,
C 16:1 and C 18:1 , respectively; the related methyl-branched chain acids concern
tuberculostearic acid (10-methyl stearic acid) and tuberculopalmitate
(10-methyl palmitic acid), 19b and 17b, respectively. (a, b) mean
112
Marie-Antoinette Lane ´ elle et al.
16
17B
17
18e
18
19B
20
M 24 M 26 M 29 M 32
P 25
P 27 26
22 24
28
14
16
18
18e
19B
22
24
GC
MS
Molecular weight
M detected
RT order
Characteristic peak
M methyl ester
m/z
14:0
74
256
M or M-32
16:1
55
268
M
16:0
74
270
M or M-32
17B
74
284
M
(a) 2-octadecanol #
45
270
M-18
18:1
55
296
M
18:0
74
298
M and M-32
19B
74
312
M
(b) 2-eicosanol #
45
298
M-18
20:0
74
326
M or M-32
22:0
74
354
M or M-32
M24:0
88
382
M
P25:1*
127 and 169
394
M
24:0
74
382
M or M-32
M26
88
410
M
P27:1*
127 and 169
422
M
26:0
74
410
M or M-32
M29
88
452
M
M32
88
494
M
14
16e
a
b
20
22
26
100°
160°
210°
270°C
Fig. 2 GC profile of FAME and alcohols of M. tuberculosis (upper) and M. avium
(lower) and identification of compounds by EI-mass spectrometry. Compounds
identified by their fragmentation in MS are presented according to their retention
time (RT) in GC. 16e and 18e in the GC profiles indicate ethylenic homologues,
C 16:1 and C 18:1 , respectively; the related methyl-branched chain acids concern
tuberculostearic acid (10-methyl stearic acid) and tuberculopalmitate
(10-methyl palmitic acid), 19b and 17b, respectively. (a, b) mean
112
Marie-Antoinette Lane ´ elle et al.