

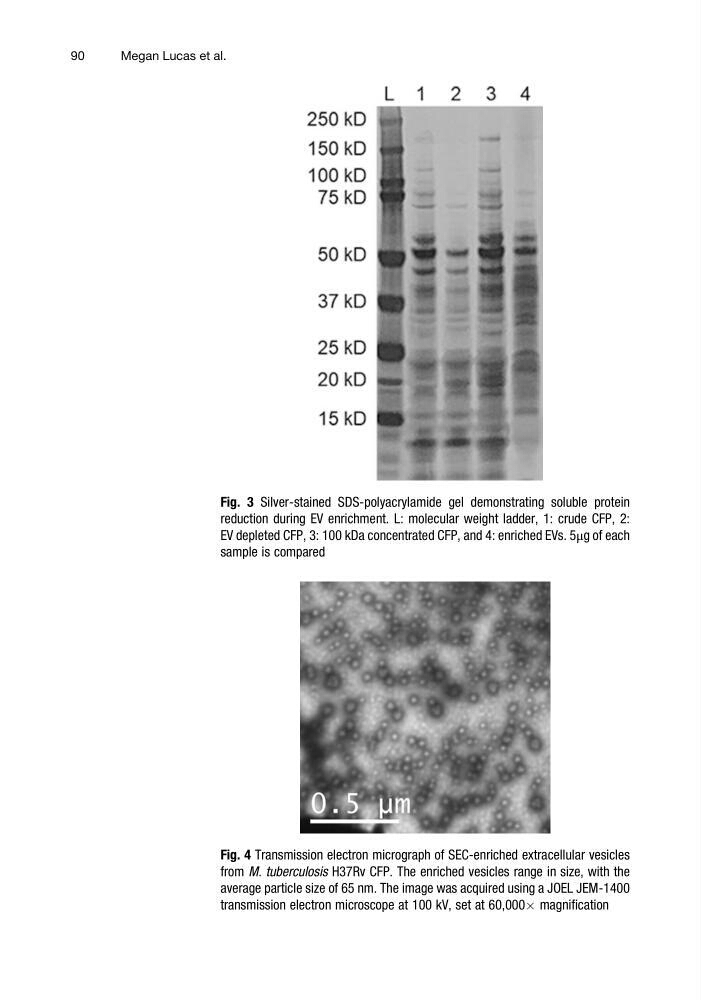
Fig. 3 Silver-stained SDS-polyacrylamide gel demonstrating soluble protein
reduction during EV enrichment. L: molecular weight ladder, 1: crude CFP, 2:
EV depleted CFP, 3: 100 kDa concentrated CFP, and 4: enriched EVs. 5μg of each
sample is compared
Fig. 4 Transmission electron micrograph of SEC-enriched extracellular vesicles
from M. tuberculosis H37Rv CFP. The enriched vesicles range in size, with the
average particle size of 65 nm. The image was acquired using a JOEL JEM-1400
transmission electron microscope at 100 kV, set at 60,000Â magnification
90
Megan Lucas et al.
reduction during EV enrichment. L: molecular weight ladder, 1: crude CFP, 2:
EV depleted CFP, 3: 100 kDa concentrated CFP, and 4: enriched EVs. 5μg of each
sample is compared
Fig. 4 Transmission electron micrograph of SEC-enriched extracellular vesicles
from M. tuberculosis H37Rv CFP. The enriched vesicles range in size, with the
average particle size of 65 nm. The image was acquired using a JOEL JEM-1400
transmission electron microscope at 100 kV, set at 60,000Â magnification
90
Megan Lucas et al.