

55
Cadmium [Cd, 48]
Cd mobility in soils. According to Matusik et al. (2008) Cd–phosphate compounds are
formed under the influence of soil pH. Also, Cd sorption by goethite increases with soil
pH, and reaches the maximum at pH about 7–9 (Violante 2013).
To summarize results of several studies on the Cd fixation in soils, it may be generalized that (1) in all soils, Cd mobility is strongly affected by pH; (2) in acidic soils, the
soluble organic matter and sesquioxides largely control Cd activity; (3) in alkaline soils,
precipitations with carbonates and phosphates have a great impact on Cd behavior.
Soil microbial activities play a significant role in Cd behavior in soils. Micro organisms
may bond with Cd and later on release to the soil solution. Microorganisms have a great
capability to accumulate Cd (up to 1120 mg/kg) and thus, the remediation technique based
on inoculating soils with microorganisms has been proposed for Cd-contaminated soils
(Burd et al. 2000). Some actinomycete strains may absorb much Cd and are proposed for
the bioremediation of contaminated soils (Amoroso and Abate 2012). Increasing alkalinity of soils is also suggested for soil remediation, because it decreases Cd adsorption,
probably due to the competition from Ca and Mg (Laxen 1985).
Soil contamination with Cd is believed to be the most serious health risk. Elevated
Cd contents in soils are mainly human-induced, but sometimes it may also be of
geogenic soil origin. For example, soils derived from altered pyritized andesine in
Slovakia contain up to 222 mg Cd/kg (Čurlik and Šefčik 1999). Other Cd-enriched
soils, up to about 8 mg/kg, are derived from Jurassic or Cretaceous limestone or from
bauxite, up to 192 mg/kg (Davies et al. 2003).
Major sources of Cd contamination are atmospheric deposition, and sludge and
P fertilizers. About 10%–15% of total airborne Cd emissions arise from natural
sources, mainly volcanic activities. It has been calculated that the annual Cd natural emission may range between 150 and 2600 t (Ursinyova and Hladikova 2000).
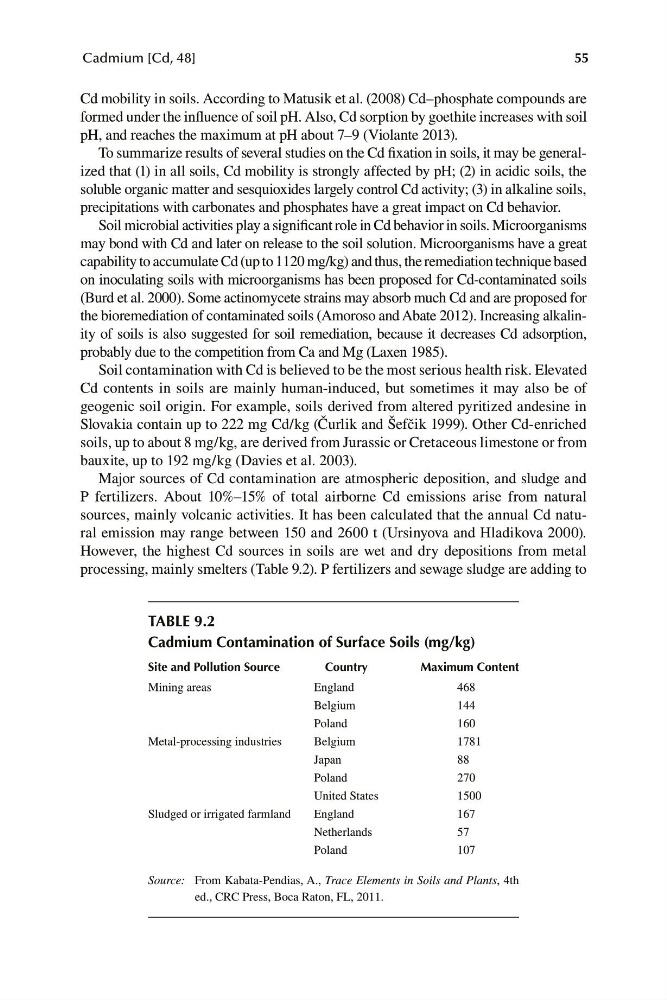
However, the highest Cd sources in soils are wet and dry depositions from metal
processing, mainly smelters (Table 9.2). P fertilizers and sewage sludge are adding to
TABLE 9.2
Cadmium Contamination of Surface Soils (mg/kg)
Site and Pollution Source
Country
Maximum Content
Mining areas
England
Belgium
Poland
468
144
160
Metal-processing industries
Belgium
Japan
Poland
1781
88
270
United States
1500
Sludged or irrigated farmland
England
Netherlands
167
57
Poland
107
Source: From Kabata-Pendias, A., Trace Elements in Soils and Plants, 4th
ed., CRC Press, Boca Raton, FL, 2011.