

40
Trace Elements in Abiotic and Biotic Environments
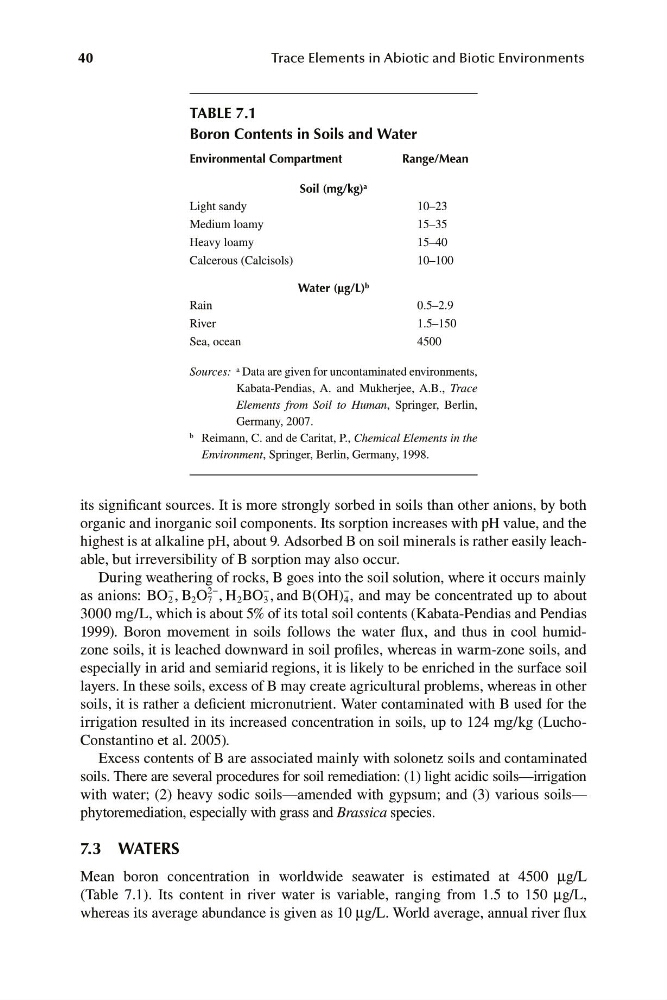
TABLE 7.1
Boron Contents in Soils and Water
Environmental Compartment
Range/Mean
Soil (mg/kg) a
Light sandy
10–23
Medium loamy
15–35
Heavy loamy
15–40
Calcerous (Calcisols)
10–100
Water (μg/L) b
Rain
0.5–2.9
River
1.5–150
Sea, ocean
4500
Sources: a Data are given for uncontaminated environments,
Kabata-Pendias, A. and Mukherjee, A.B., Trace
Elements from Soil to Human, Springer, Berlin,
Germany, 2007.
b Reimann, C. and de Caritat, P., Chemical Elements in the
Environment, Springer, Berlin, Germany, 1998.
its significant sources. It is more strongly sorbed in soils than other anions, by both
organic and inorganic soil components. Its sorption increases with pH value, and the
highest is at alkaline pH, about 9. Adsorbed B on soil minerals is rather easily leachable, but irreversibility of B sorption may also occur.
During weathering of rocks, B goes into the soil solution, where it occurs mainly
2
as anions: BO , B O , H BO , and B(OH)
, and may be concentrated up to about
2
2 7
2
3
4
3000 mg/L, which is about 5% of its total soil contents (Kabata-Pendias and Pendias
1999). Boron movement in soils follows the water flux, and thus in cool humidzone soils, it is leached downward in soil profiles, whereas in warm-zone soils, and
especially in arid and semiarid regions, it is likely to be enriched in the surface soil
layers. In these soils, excess of B may create agricultural problems, whereas in other
soils, it is rather a deficient micronutrient. Water contaminated with B used for the
irrigation resulted in its increased concentration in soils, up to 124 mg/kg (LuchoConstantino et al. 2005).
Excess contents of B are associated mainly with solonetz soils and contaminated
soils. There are several procedures for soil remediation: (1) light acidic soils—irrigation
with water; (2) heavy sodic soils—amended with gypsum; and (3) various soils—
phytoremediation, especially with grass and Brassica species.
7.3 WATERS
Mean boron concentration in worldwide seawater is estimated at 4500 μg/L
(Table 7.1). Its content in river water is variable, ranging from 1.5 to 150 μg/L,
whereas its average abundance is given as 10 μg/L. World average, annual river flux