

36
Trace Elements in Abiotic and Biotic Environments
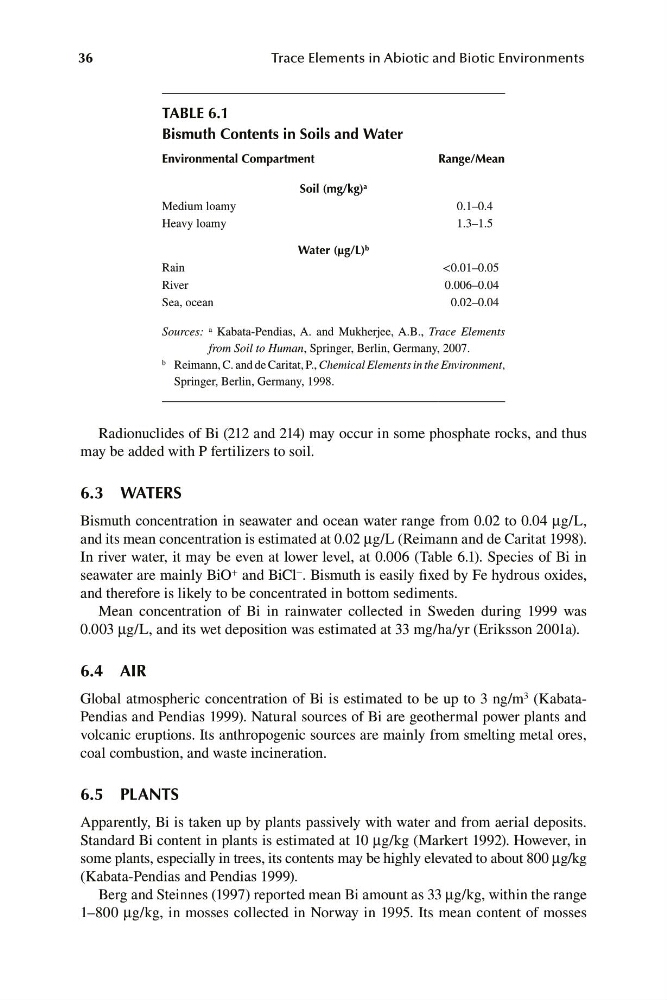
TABLE 6.1
Bismuth Contents in Soils and Water
Environmental Compartment
Range/Mean
Soil (mg/kg) a
Medium loamy
0.1–0.4
Heavy loamy
1.3–1.5
Water (μg/L) b
Rain
<0.01–0.05
River
0.006–0.04
Sea, ocean
0.02–0.04
a
Sources: Kabata-Pendias, A. and Mukherjee, A.B., Trace Elements
from Soil to Human, Springer, Berlin, Germany, 2007.
b Reimann, C. and de Caritat, P., Chemical Elements in the Environment,
Springer, Berlin, Germany, 1998.
Radionuclides of Bi (212 and 214) may occur in some phosphate rocks, and thus
may be added with P fertilizers to soil.
6.3 WATERS
Bismuth concentration in seawater and ocean water range from 0.02 to 0.04 μg/L,
and its mean concentration is estimated at 0.02 μg/L (Reimann and de Caritat 1998).
In river water, it may be even at lower level, at 0.006 (Table 6.1). Species of Bi in
seawater are mainly BiO + and BiCl − . Bismuth is easily fixed by Fe hydrous oxides,
and therefore is likely to be concentrated in bottom sediments.
Mean concentration of Bi in rainwater collected in Sweden during 1999 was
0.003 μg/L, and its wet deposition was estimated at 33 mg/ha/yr (Eriksson 2001a).
6.4 AIR
Global atmospheric concentration of Bi is estimated to be up to 3 ng/m 3 (KabataPendias and Pendias 1999). Natural sources of Bi are geothermal power plants and
volcanic eruptions. Its anthropogenic sources are mainly from smelting metal ores,
coal combustion, and waste incineration.
6.5 PLANTS
Apparently, Bi is taken up by plants passively with water and from aerial deposits.
Standard Bi content in plants is estimated at 10 μg/kg (Markert 1992). However, in
some plants, especially in trees, its contents may be highly elevated to about 800 μg/kg
(Kabata-Pendias and Pendias 1999).
Berg and Steinnes (1997) reported mean Bi amount as 33 μg/kg, within the range
1–800 μg/kg, in mosses collected in Norway in 1995. Its mean content of mosses