

33
Beryllium [Be, 4]
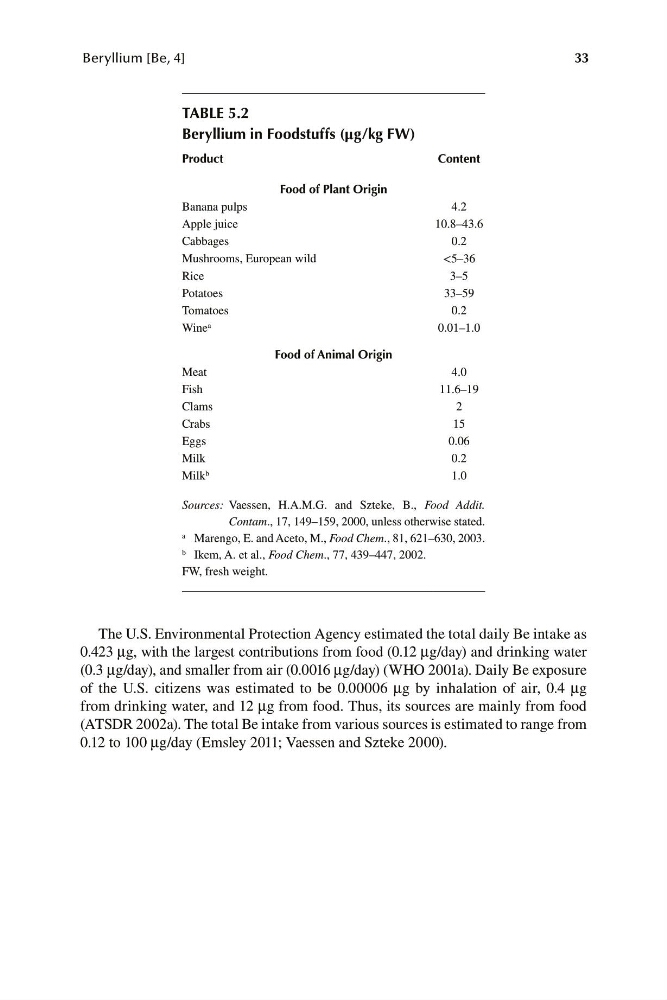
TABLE 5.2
Beryllium in Foodstuffs (μg/kg FW)
Product
Content
Food of Plant Origin
Banana pulps
4.2
Apple juice
10.8–43.6
Cabbages
0.2
Mushrooms, European wild
<5–36
Rice
3–5
Potatoes
33–59
Tomatoes
0.2
Wine a
0.01–1.0
Food of Animal Origin
Meat
4.0
Fish
11.6–19
Clams
2
Crabs
15
Eggs
0.06
Milk
0.2
Milk b
1.0
Sources: Vaessen, H.A.M.G. and Szteke, B., Food Addit.
Contam., 17, 149–159, 2000, unless otherwise stated.
a Marengo, E. and Aceto, M., Food Chem., 81, 621–630, 2003.
b Ikem, A. et al., Food Chem., 77, 439–447, 2002.
FW, fresh weight.
The U.S. Environmental Protection Agency estimated the total daily Be intake as
0.423 μg, with the largest contributions from food (0.12 μg/day) and drinking water
(0.3 μg/day), and smaller from air (0.0016 μg/day) (WHO 2001a). Daily Be exposure
of the U.S. citizens was estimated to be 0.00006 μg by inhalation of air, 0.4 μg
from drinking water, and 12 μg from food. Thus, its sources are mainly from food
(ATSDR 2002a). The total Be intake from various sources is estimated to range from
0.12 to 100 μg/day (Emsley 2011; Vaessen and Szteke 2000).