

386
Trace Elements in Abiotic and Biotic Environments
58.3.3 WATERS
The worldwide average U concentration in river waters is estimated to be 0.372 μg/L,
within the range of 0.02–4.94 μg/L (Gaillardet et al. 2003). The Baltic Sea waters
contains U from 0.67 to 1.65 μg/L (Szefer 2002), and its mean concentration in the
North Pacific is 3.2 μg/L (Nozaki 2005).
Radioactive 238 U of water basins in Poland was at the level 8.37 mBq/L, during
the period 1998–1991, and has not changed after the Chernobyl accident (Skwarzec
1997). Annual discharge of 238 U with water of Vistula river system to the Baltic Sea
is estimated to be 240 GBq (Kabat et al. 2013).
The median U concentration in bottled waters of the EU countries is 0.209 μg/L
and is slightly lower than in tap waters, estimated to be 0.307 μg/L (Birke et al.
2010). The World Health Organization (WHO) established 30 μg/L as a provisional
guideline value for U because of scientific uncertainties about U toxicity (WHO
2011a). Levels of U in drinking waters are generally less than 1 μg/L; however,
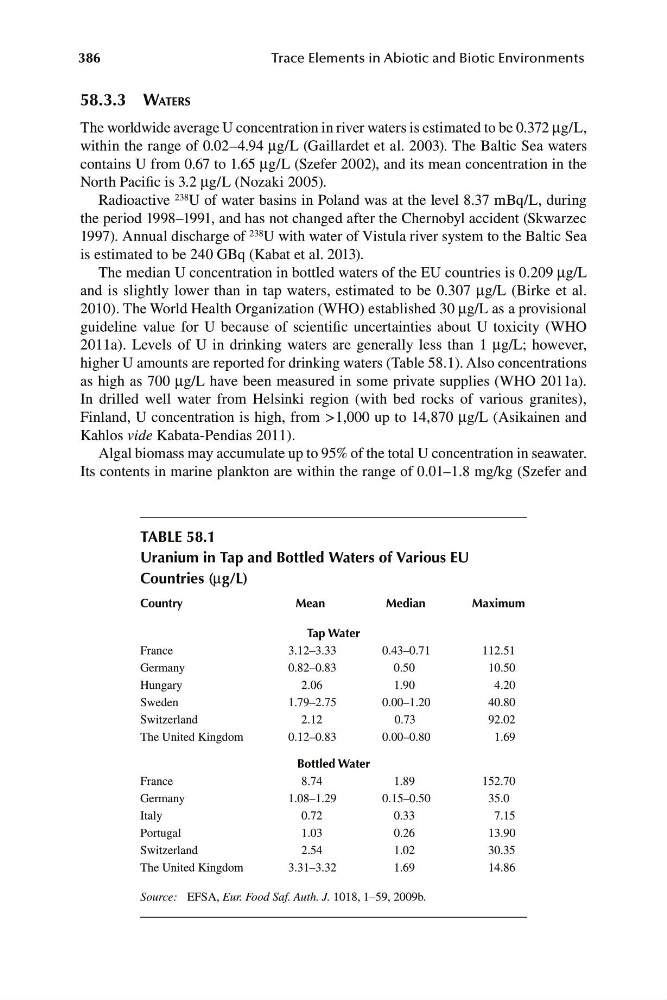
higher U amounts are reported for drinking waters (Table 58.1). Also concentrations
as high as 700 μg/L have been measured in some private supplies (WHO 2011a).
In drilled well water from Helsinki region (with bed rocks of various granites),
Finland, U concentration is high, from >1,000 up to 14,870 μg/L (Asikainen and
Kahlos vide Kabata-Pendias 2011).
Algal biomass may accumulate up to 95% of the total U concentration in seawater.
Its contents in marine plankton are within the range of 0.01–1.8 mg/kg (Szefer and
TABLE 58.1
Uranium in Tap and Bottled Waters of Various EU
Countries (μg/L)
Country
Mean
Median
Maximum
Tap Water
France
3.12–3.33
0.43–0.71
112.51
Germany
0.82–0.83
0.50
10.50
Hungary
2.06
1.90
4.20
Sweden
1.79–2.75
0.00–1.20
40.80
Switzerland
2.12
0.73
92.02
The United Kingdom
0.12–0.83
0.00–0.80
1.69
Bottled Water
France
8.74
1.89
152.70
Germany
1.08–1.29
0.15–0.50
35.0
Italy
0.72
0.33
7.15
Portugal
1.03
0.26
13.90
Switzerland
2.54
1.02
30.35
The United Kingdom
3.31–3.32
1.69
14.86
Source: EFSA, Eur. Food Saf. Auth. J. 1018, 1–59, 2009b.