

350
Trace Elements in Abiotic and Biotic Environments
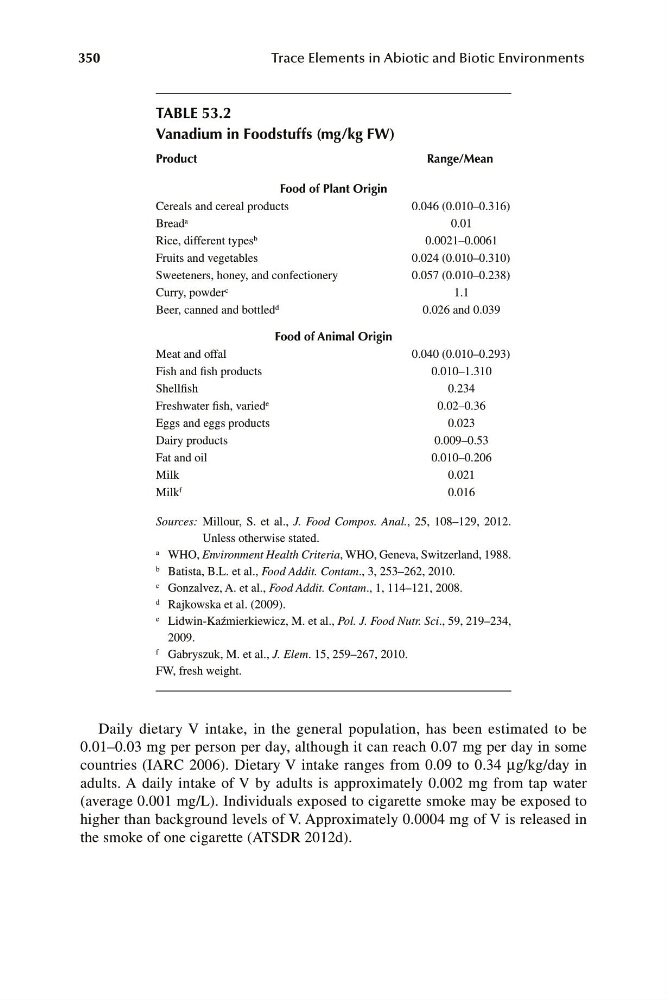
TABLE 53.2
Vanadium in Foodstuffs (mg/kg FW)
Product
Range/Mean
Food of Plant Origin
Cereals and cereal products
0.046 (0.010–0.316)
Bread a
0.01
Rice, different types b
0.0021–0.0061
Fruits and vegetables
0.024 (0.010–0.310)
Sweeteners, honey, and confectionery
0.057 (0.010–0.238)
Curry, powder c
1.1
Beer, canned and bottled d
0.026 and 0.039
Food of Animal Origin
Meat and offal
0.040 (0.010–0.293)
Fish and fish products
0.010–1.310
Shellfish
0.234
Freshwater fish, varied e
0.02–0.36
Eggs and eggs products
0.023
Dairy products
0.009–0.53
Fat and oil
0.010–0.206
Milk
0.021
Milk f
0.016
Sources: Millour, S. et al., J. Food Compos. Anal., 25, 108–129, 2012.
Unless otherwise stated.
a WHO, Environment Health Criteria, WHO, Geneva, Switzerland, 1988.
b Batista, B.L. et al., Food Addit. Contam., 3, 253–262, 2010.
c Gonzalvez, A. et al., Food Addit. Contam., 1, 114–121, 2008.
d Rajkowska et al. (2009).
e Lidwin-Kaźmierkiewicz, M. et al., Pol. J. Food Nutr. Sci., 59, 219–234,
2009.
f Gabryszuk, M. et al., J. Elem. 15, 259–267, 2010.
FW, fresh weight.
Daily dietary V intake, in the general population, has been estimated to be
0.01–0.03 mg per person per day, although it can reach 0.07 mg per day in some
countries (IARC 2006). Dietary V intake ranges from 0.09 to 0.34 μg/kg/day in
adults. A daily intake of V by adults is approximately 0.002 mg from tap water
(average 0.001 mg/L). Individuals exposed to cigarette smoke may be exposed to
higher than background levels of V. Approximately 0.0004 mg of V is released in
the smoke of one cigarette (ATSDR 2012d).
Trace Elements in Abiotic and Biotic Environments
TABLE 53.2
Vanadium in Foodstuffs (mg/kg FW)
Product
Range/Mean
Food of Plant Origin
Cereals and cereal products
0.046 (0.010–0.316)
Bread a
0.01
Rice, different types b
0.0021–0.0061
Fruits and vegetables
0.024 (0.010–0.310)
Sweeteners, honey, and confectionery
0.057 (0.010–0.238)
Curry, powder c
1.1
Beer, canned and bottled d
0.026 and 0.039
Food of Animal Origin
Meat and offal
0.040 (0.010–0.293)
Fish and fish products
0.010–1.310
Shellfish
0.234
Freshwater fish, varied e
0.02–0.36
Eggs and eggs products
0.023
Dairy products
0.009–0.53
Fat and oil
0.010–0.206
Milk
0.021
Milk f
0.016
Sources: Millour, S. et al., J. Food Compos. Anal., 25, 108–129, 2012.
Unless otherwise stated.
a WHO, Environment Health Criteria, WHO, Geneva, Switzerland, 1988.
b Batista, B.L. et al., Food Addit. Contam., 3, 253–262, 2010.
c Gonzalvez, A. et al., Food Addit. Contam., 1, 114–121, 2008.
d Rajkowska et al. (2009).
e Lidwin-Kaźmierkiewicz, M. et al., Pol. J. Food Nutr. Sci., 59, 219–234,
2009.
f Gabryszuk, M. et al., J. Elem. 15, 259–267, 2010.
FW, fresh weight.
Daily dietary V intake, in the general population, has been estimated to be
0.01–0.03 mg per person per day, although it can reach 0.07 mg per day in some
countries (IARC 2006). Dietary V intake ranges from 0.09 to 0.34 μg/kg/day in
adults. A daily intake of V by adults is approximately 0.002 mg from tap water
(average 0.001 mg/L). Individuals exposed to cigarette smoke may be exposed to
higher than background levels of V. Approximately 0.0004 mg of V is released in
the smoke of one cigarette (ATSDR 2012d).